This website is a companion to the article "Multi-resolution Common Fate Transform", which introduces the Multi-resolution Common Fate Transform (MCFT), an audio representation useful for representing mixtures of multiple audio signals that overlap in both time and frequency. Here you can find additional experimental results, audio examples and source code. For details on experimental setups, data sets used, and definitions of formulae, please see the paper.
Examples: Audio and Spectrograms
In this section, we present examples of our experimental results. Each example includes audio for the mixture, original sources, and estimated sources. We recommend to listen to audio examples with a set of headphones.
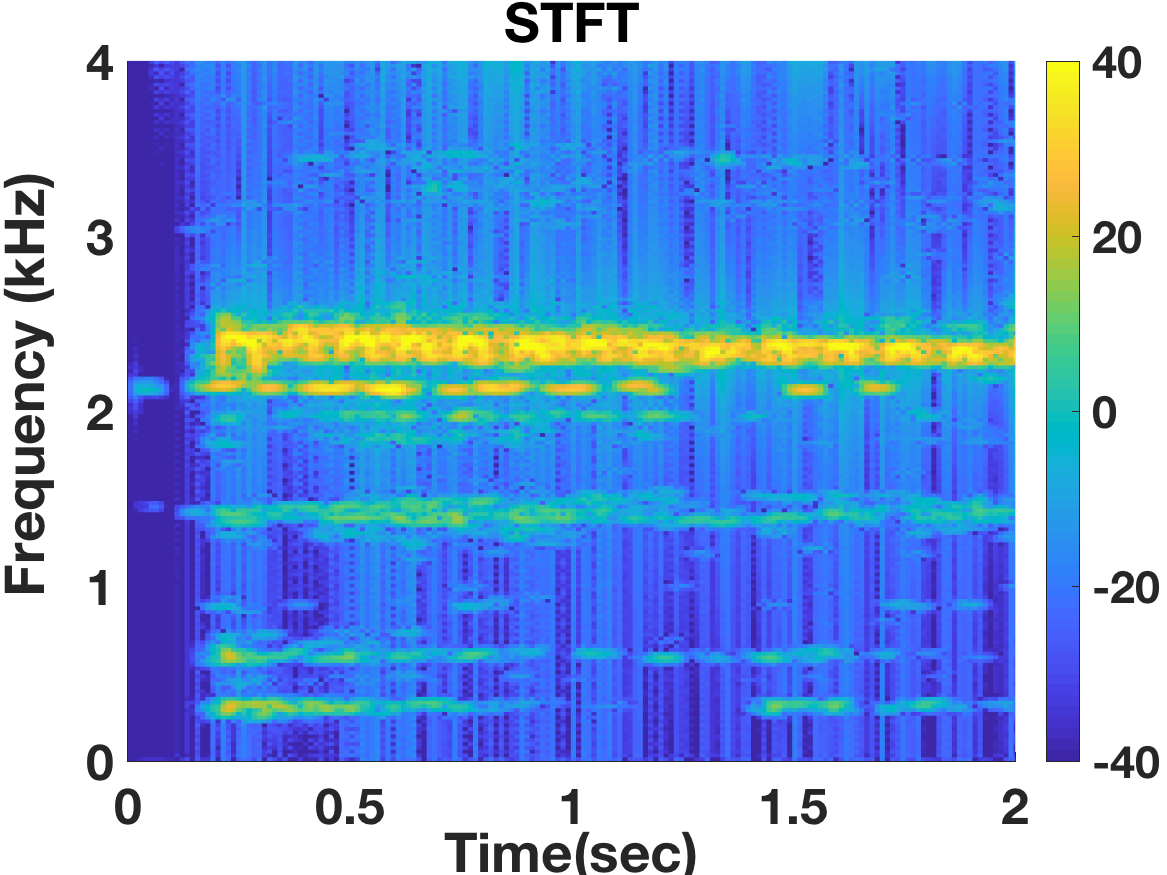
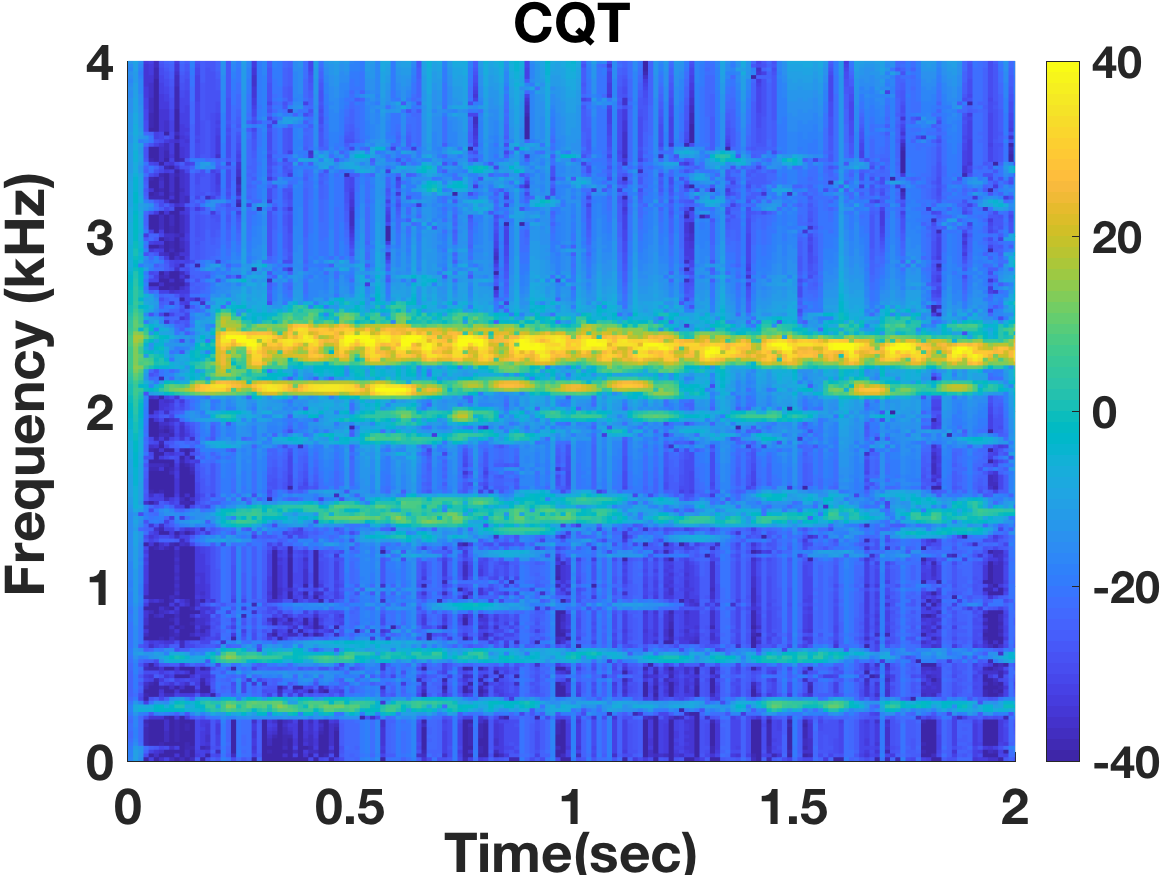
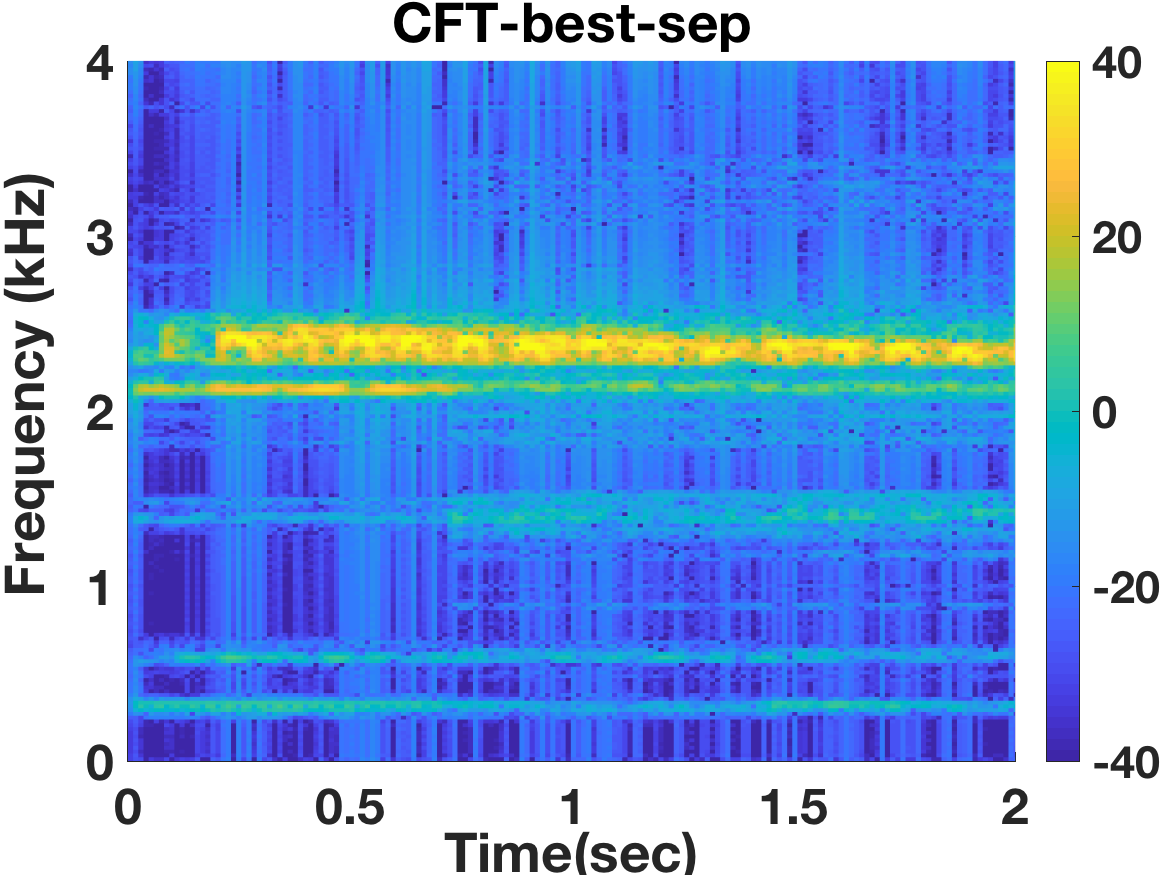
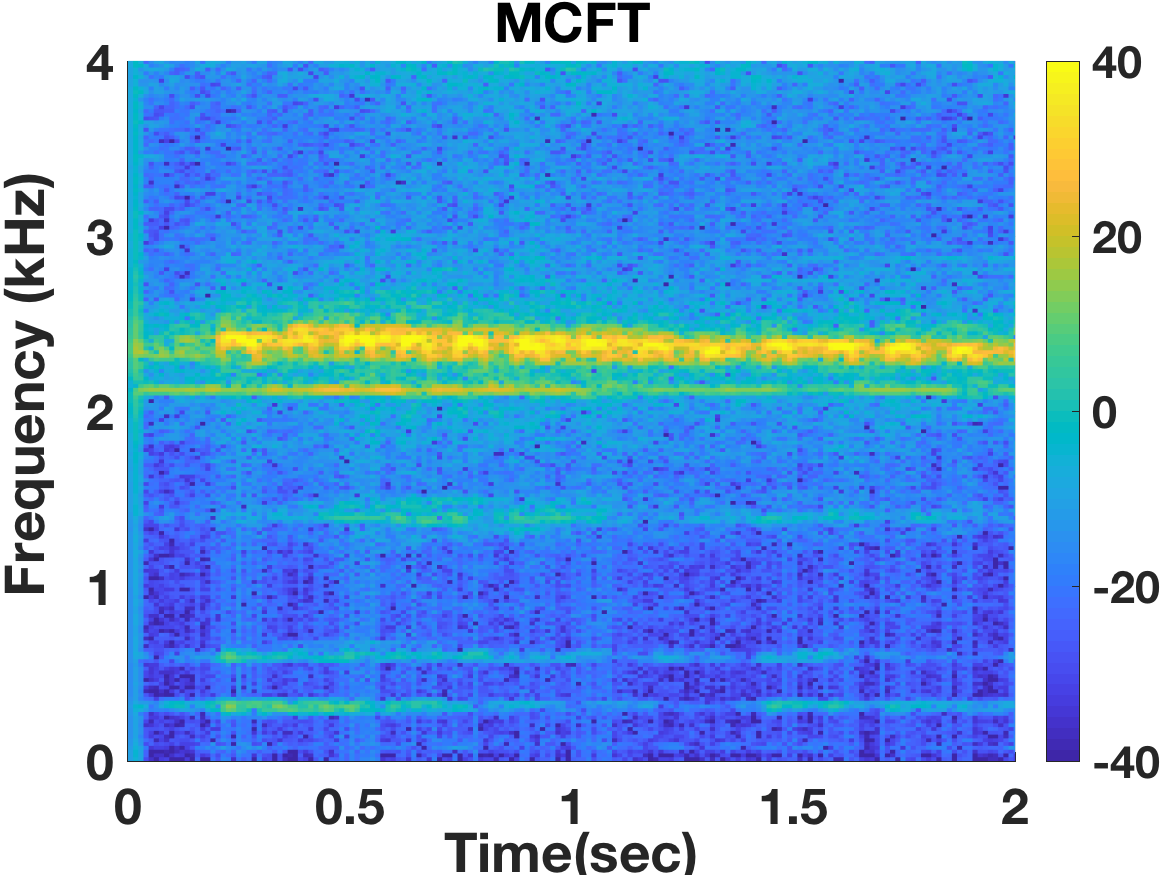
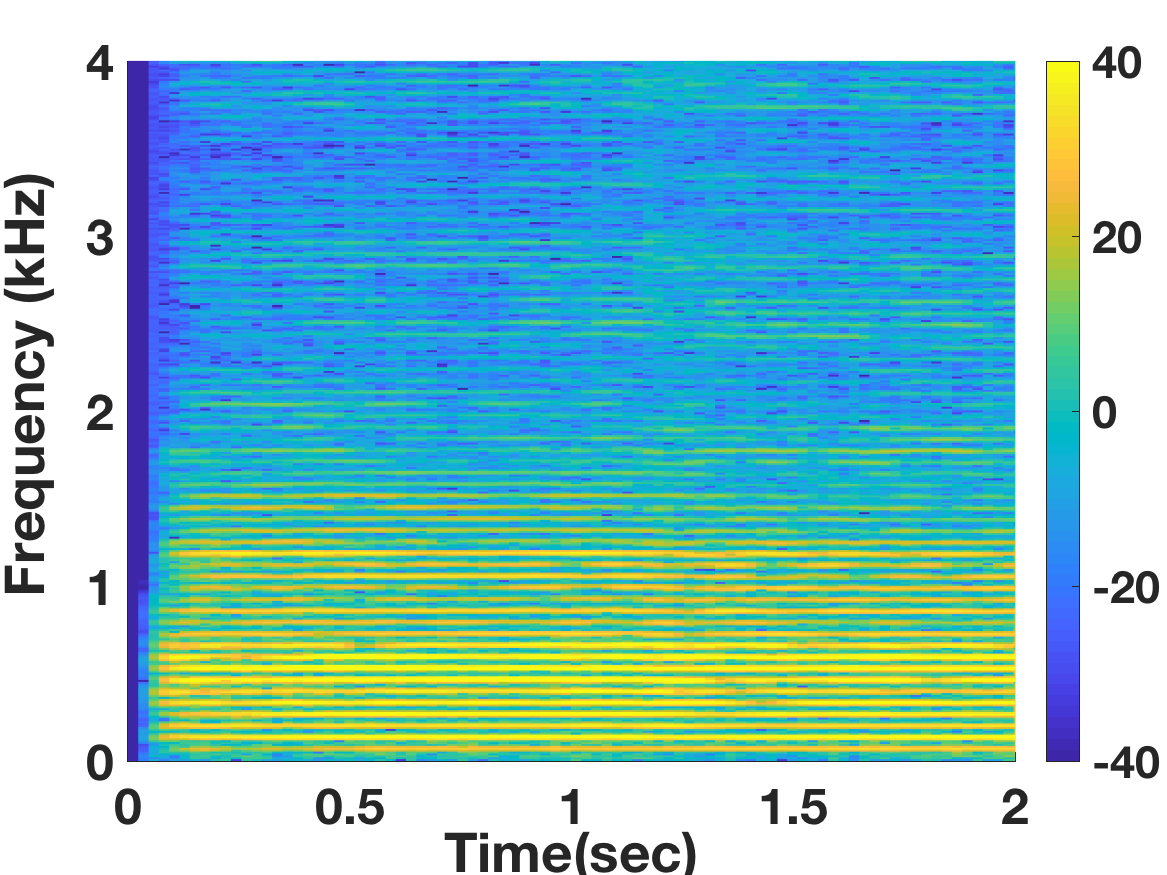
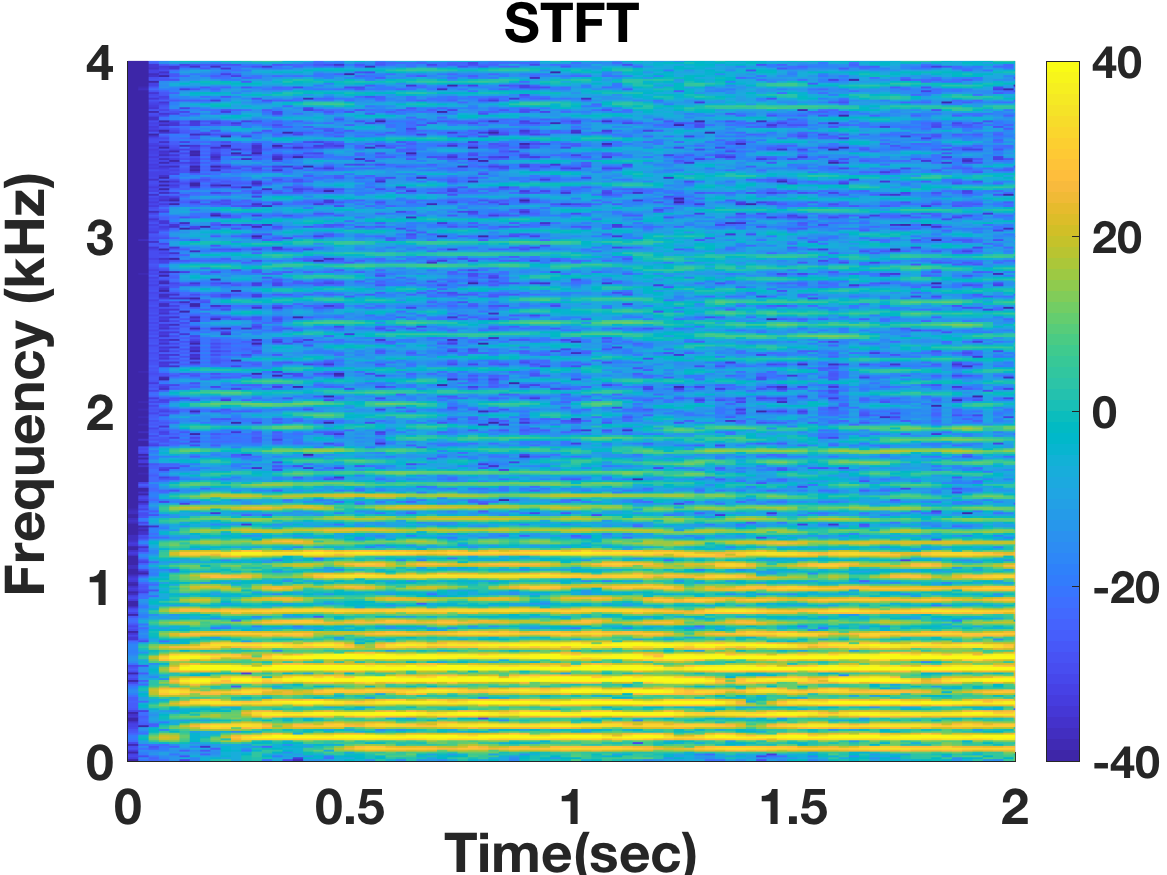
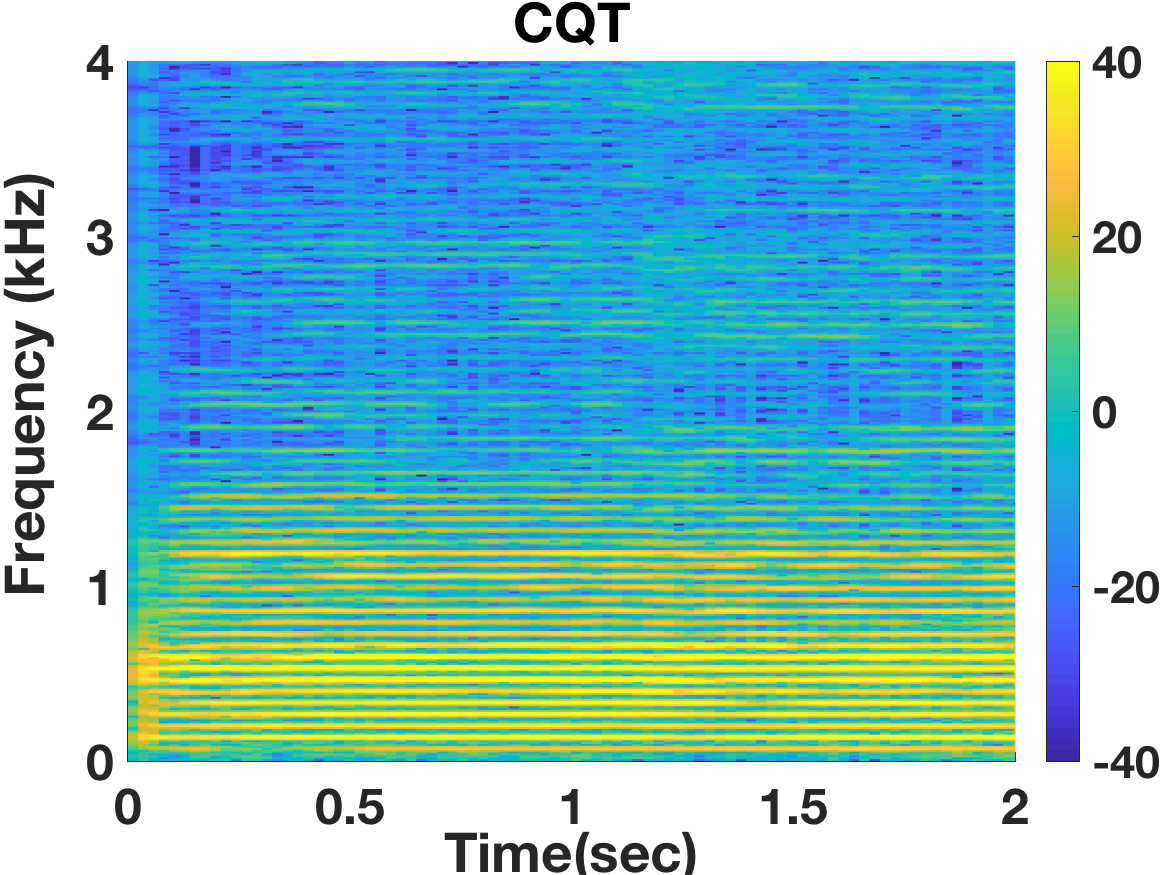
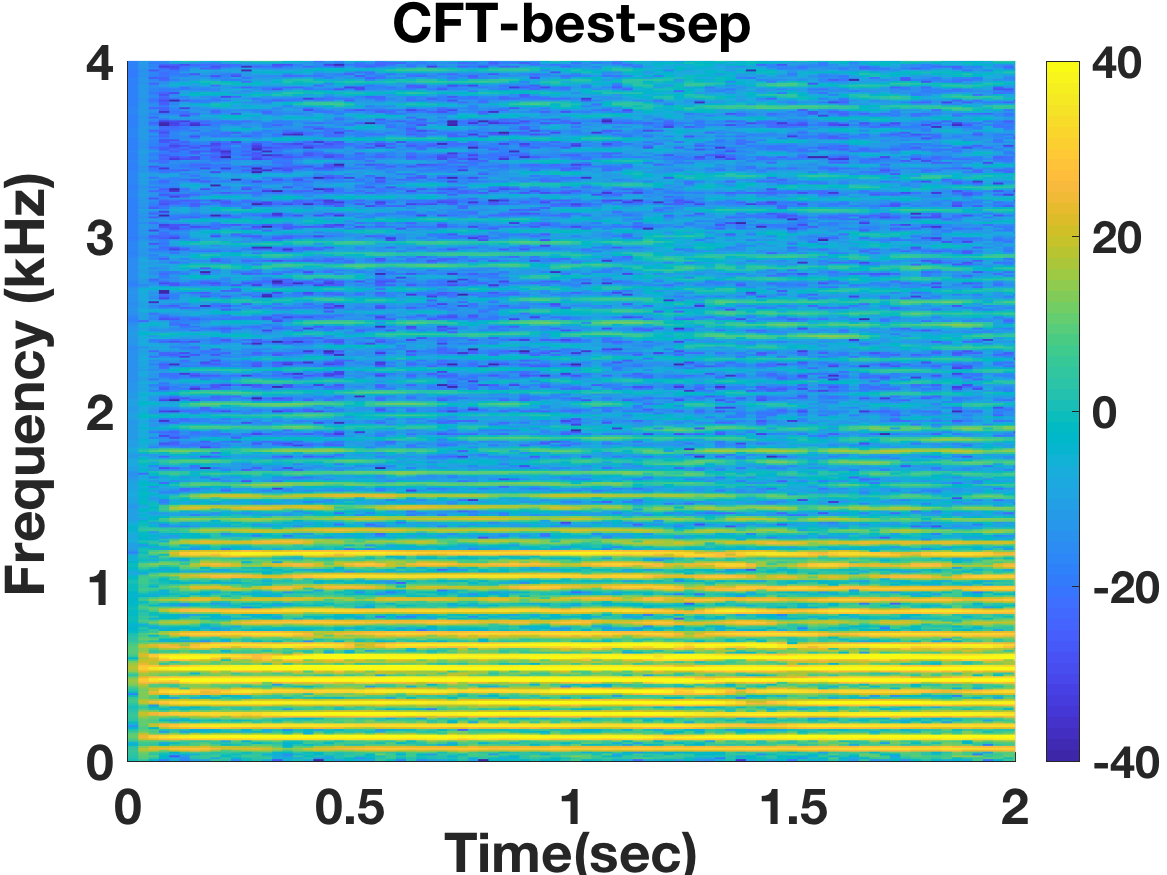
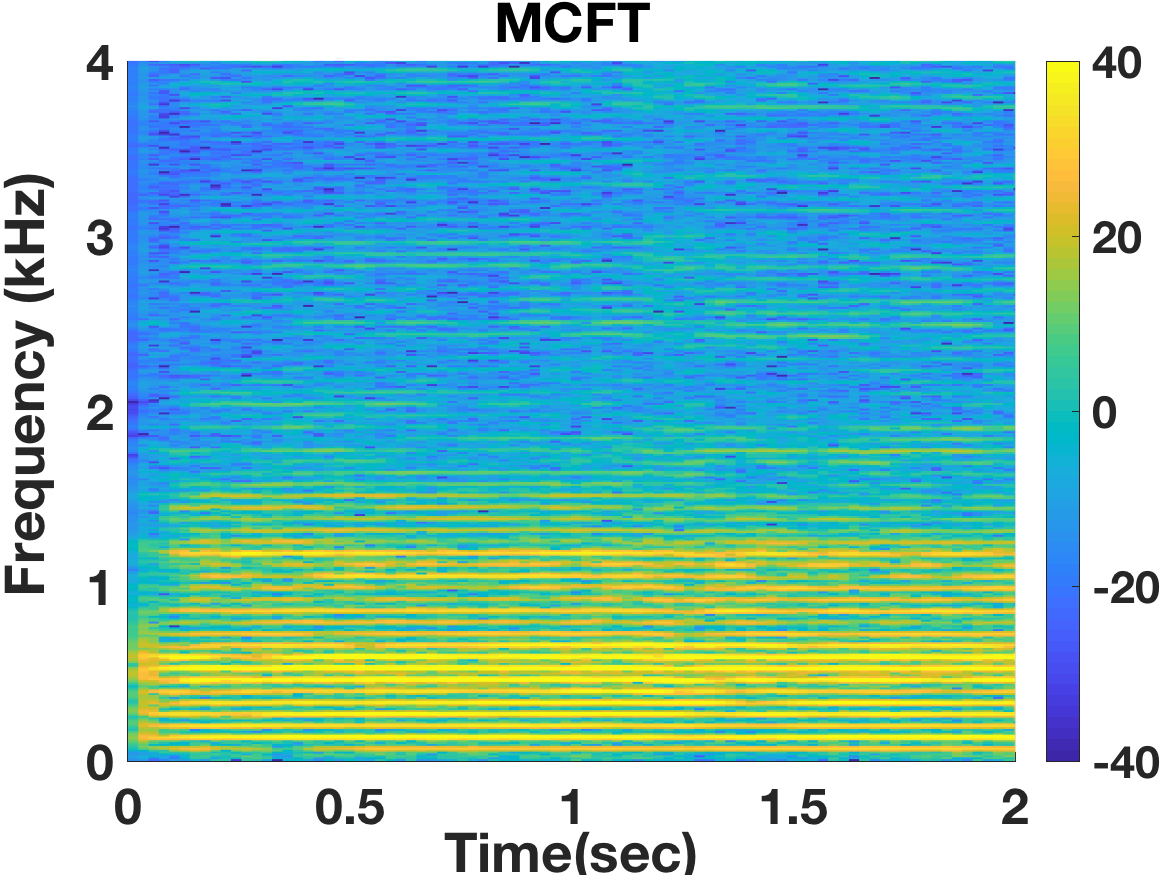
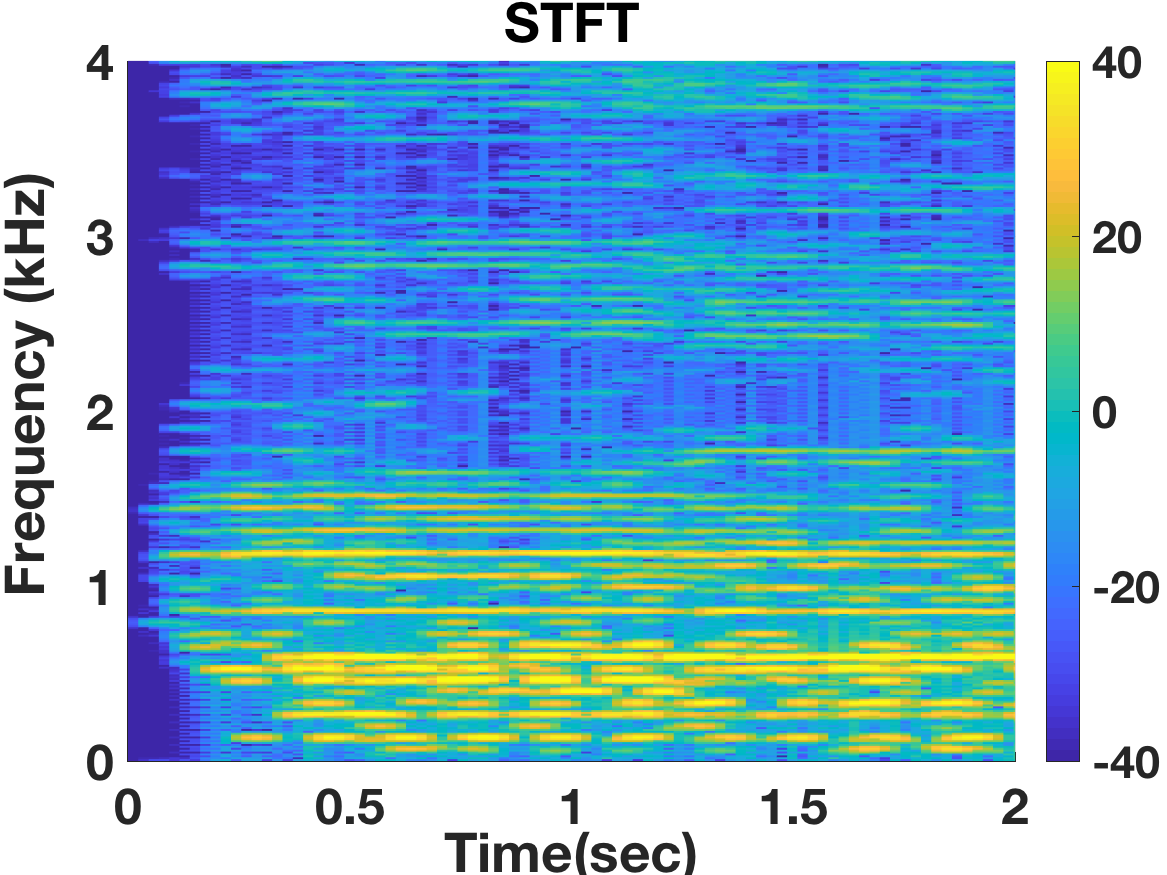
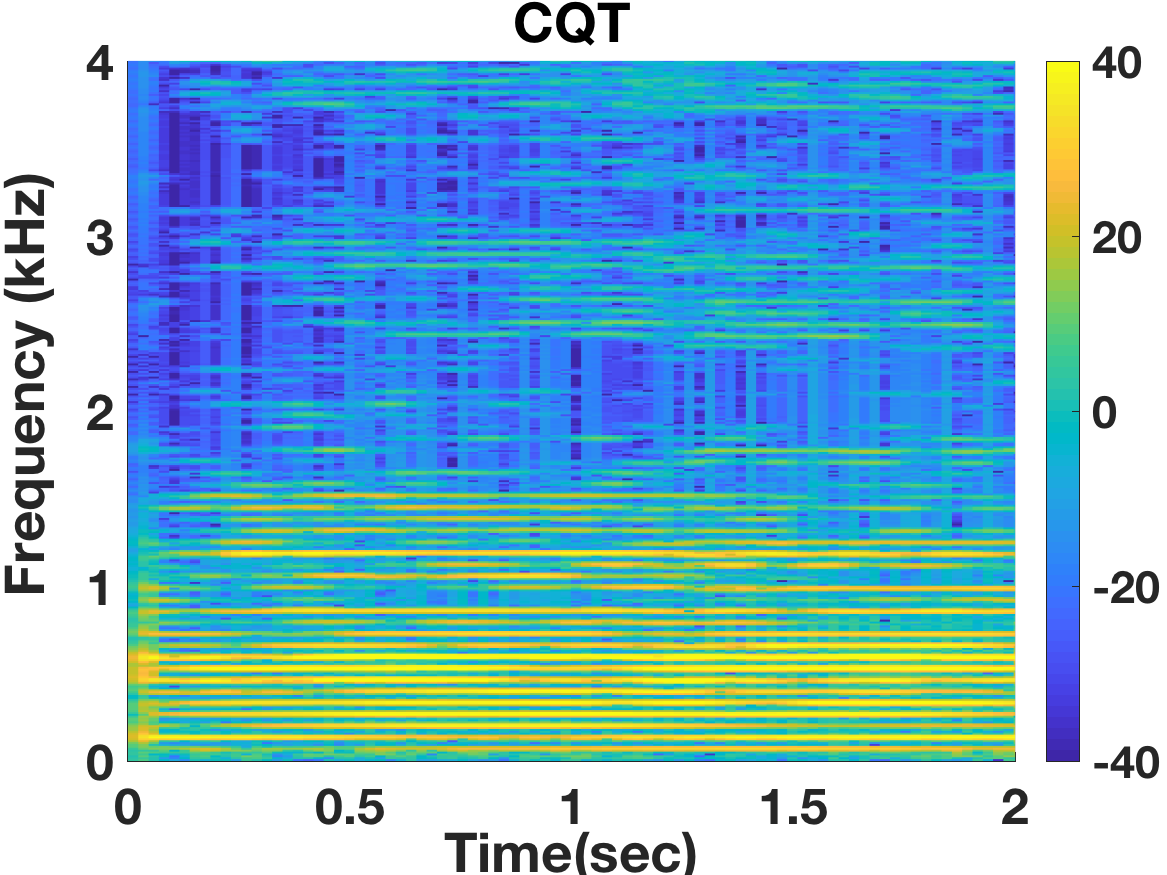
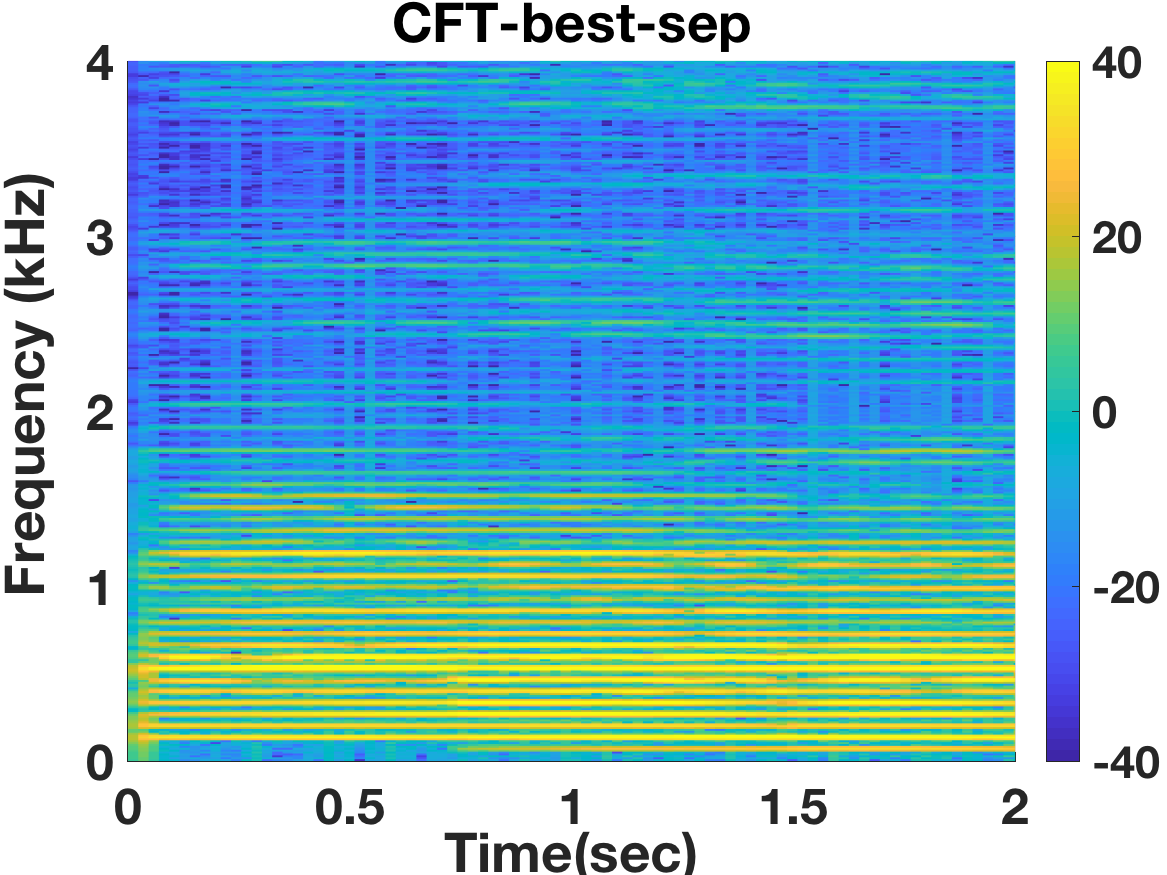
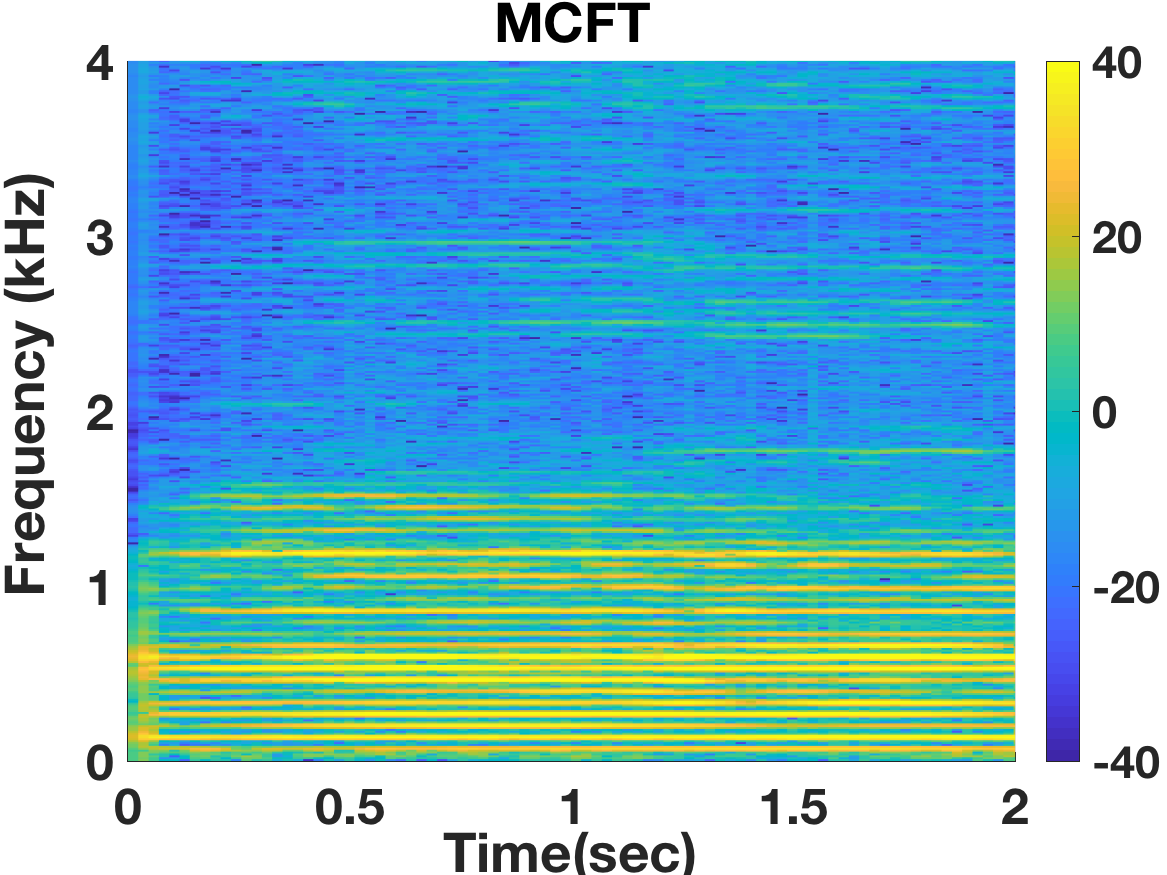
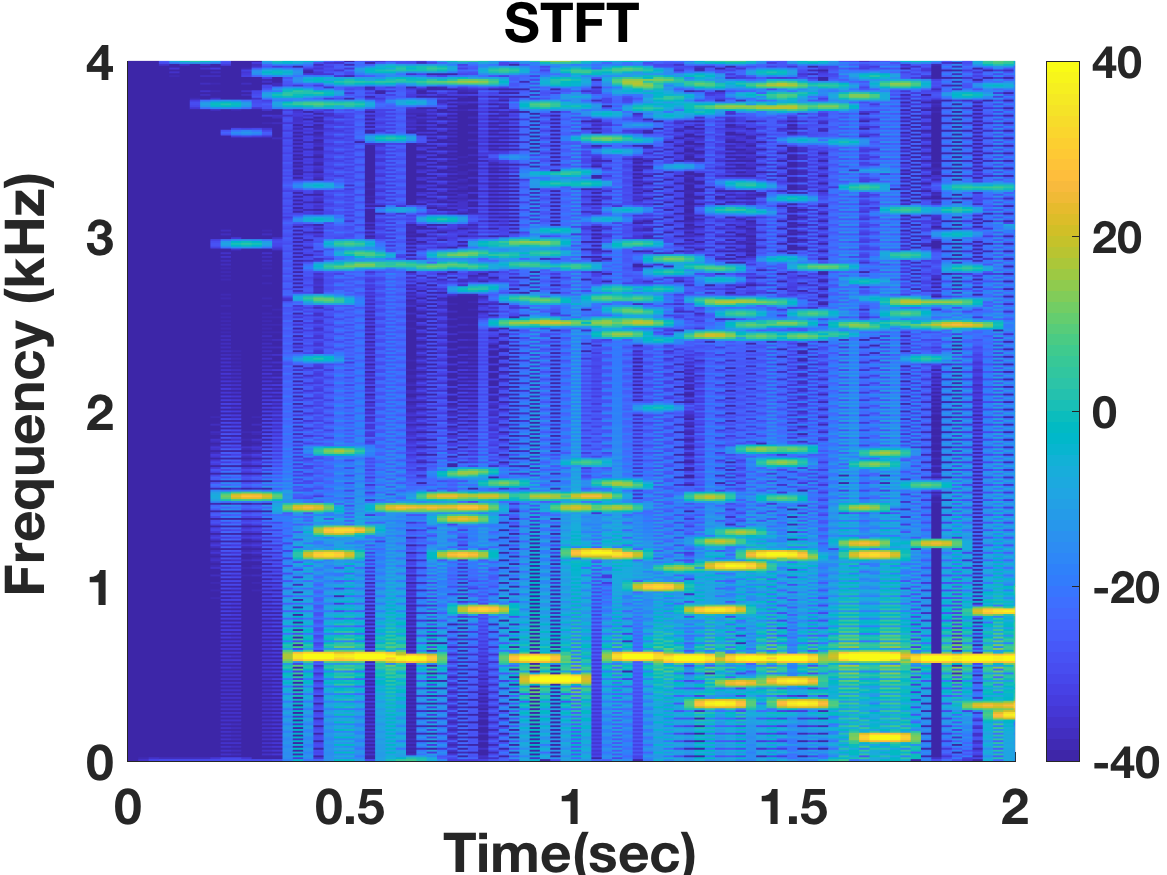
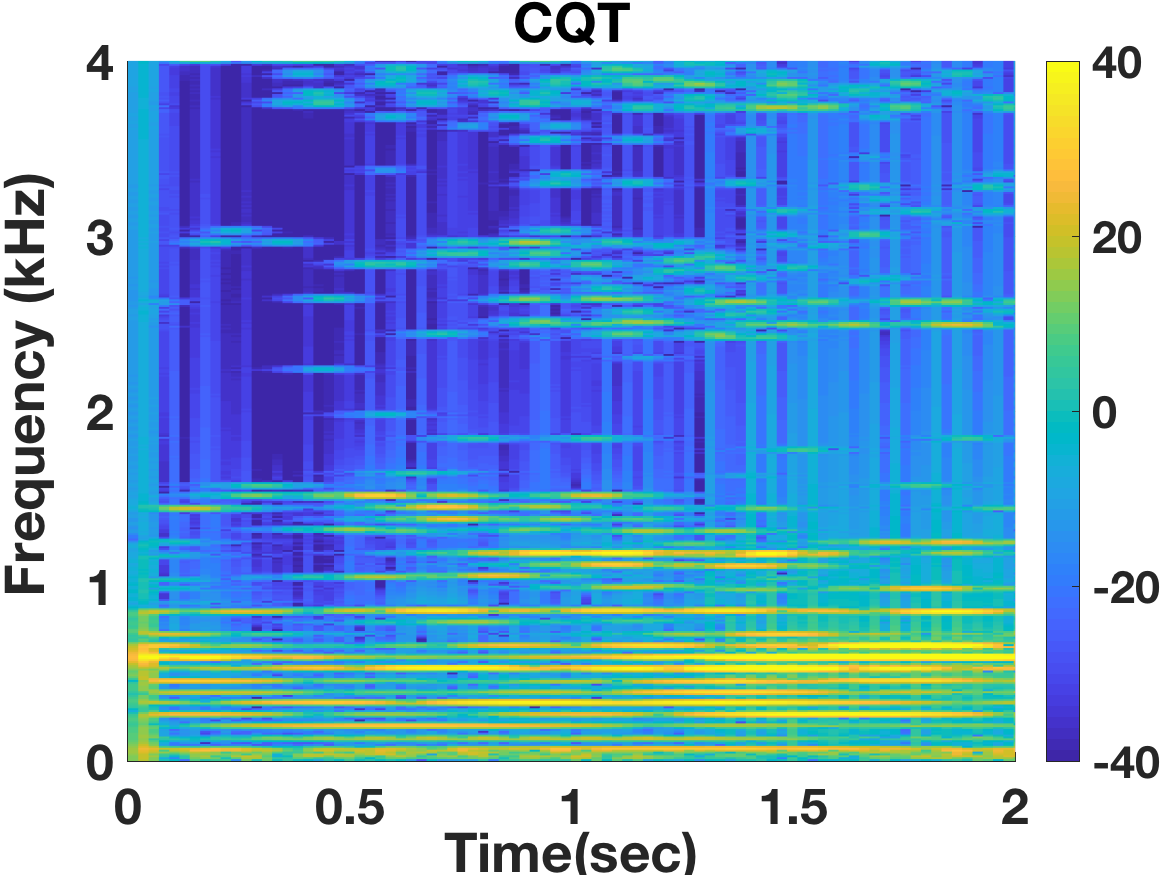
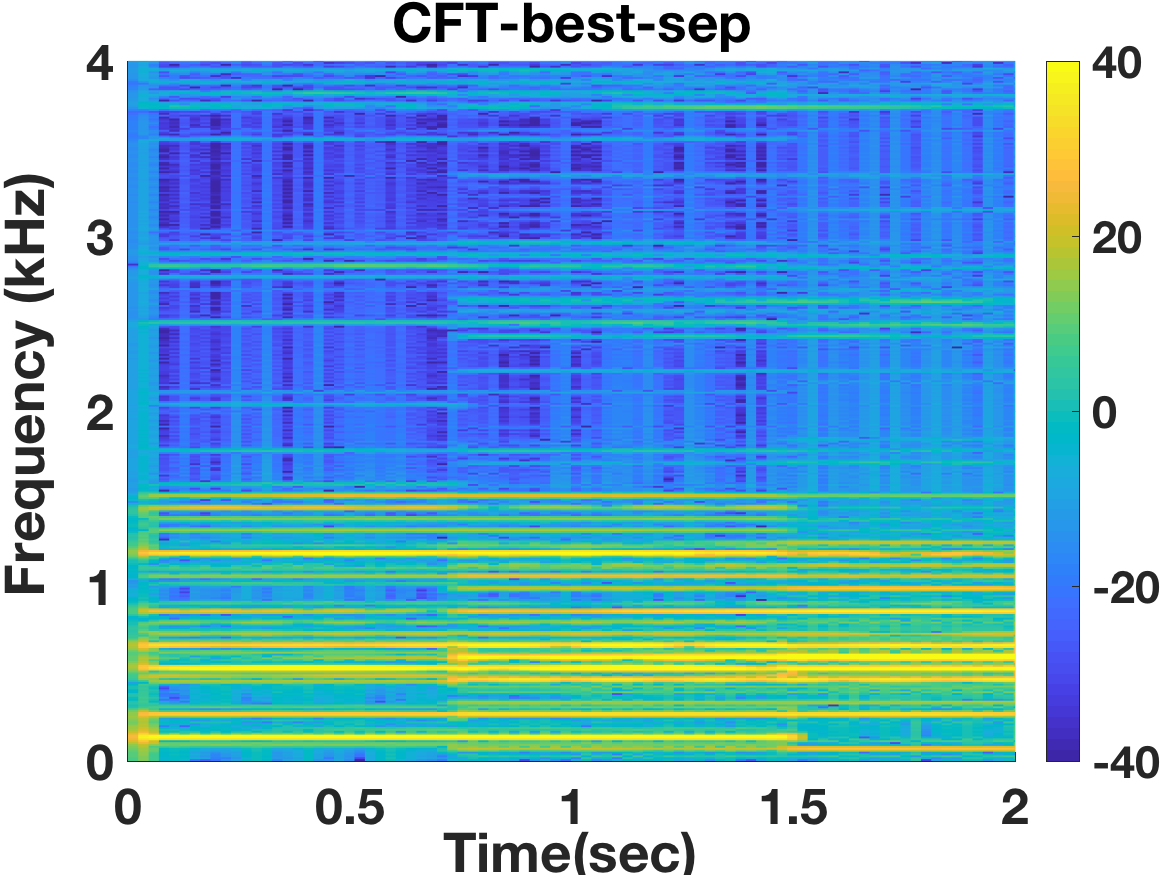
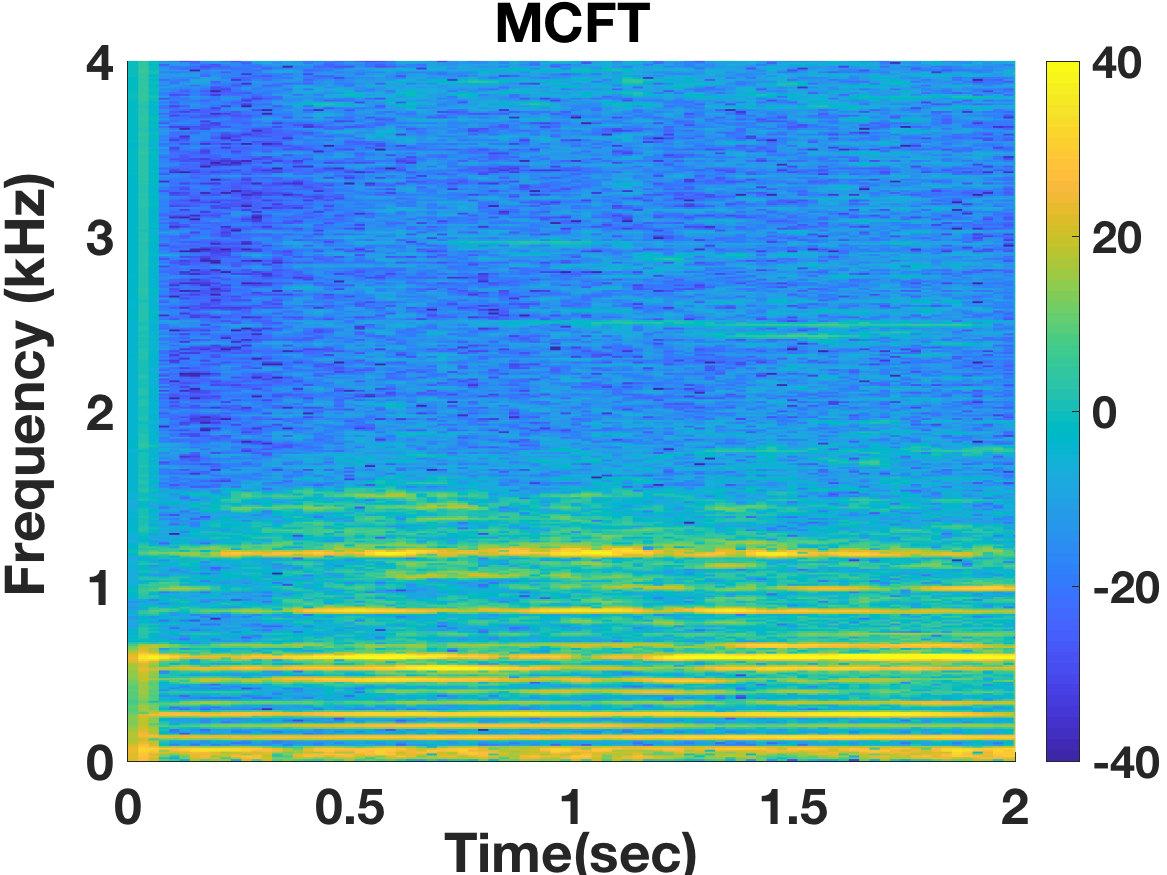
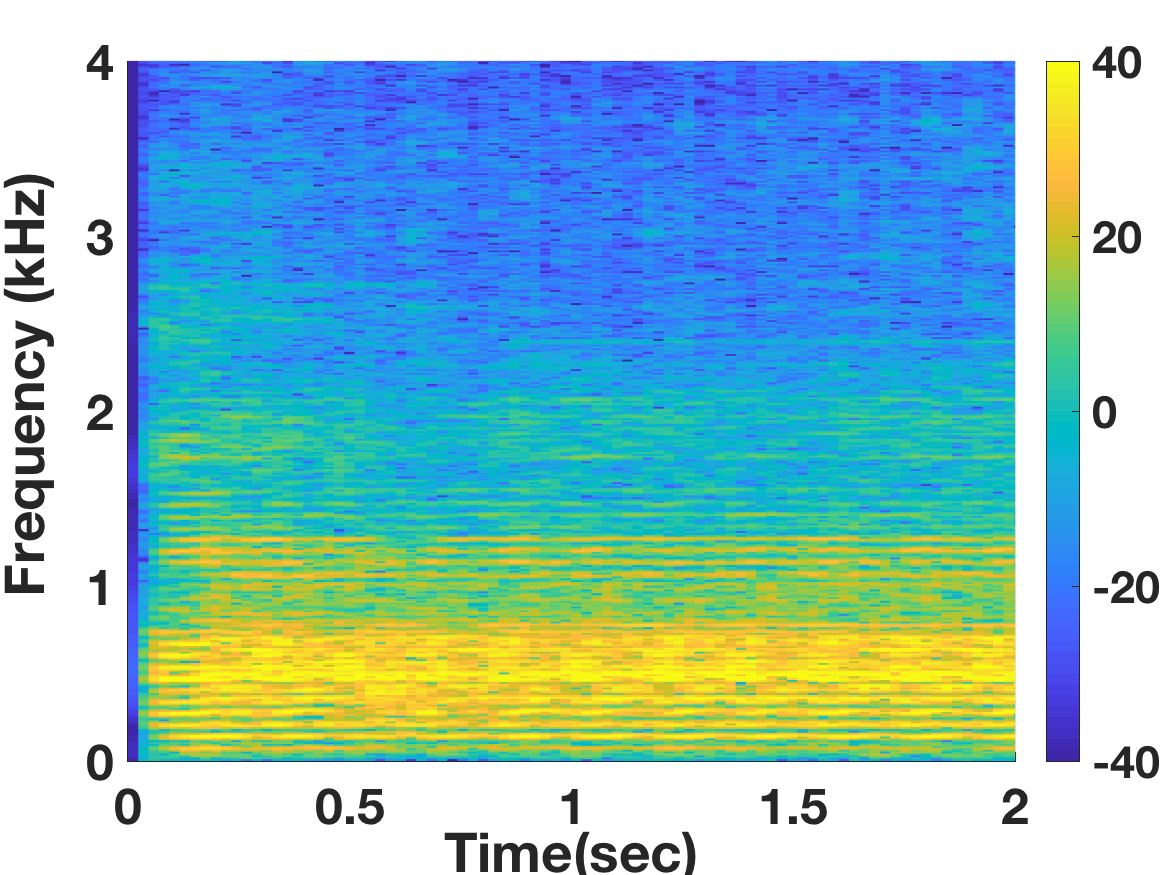
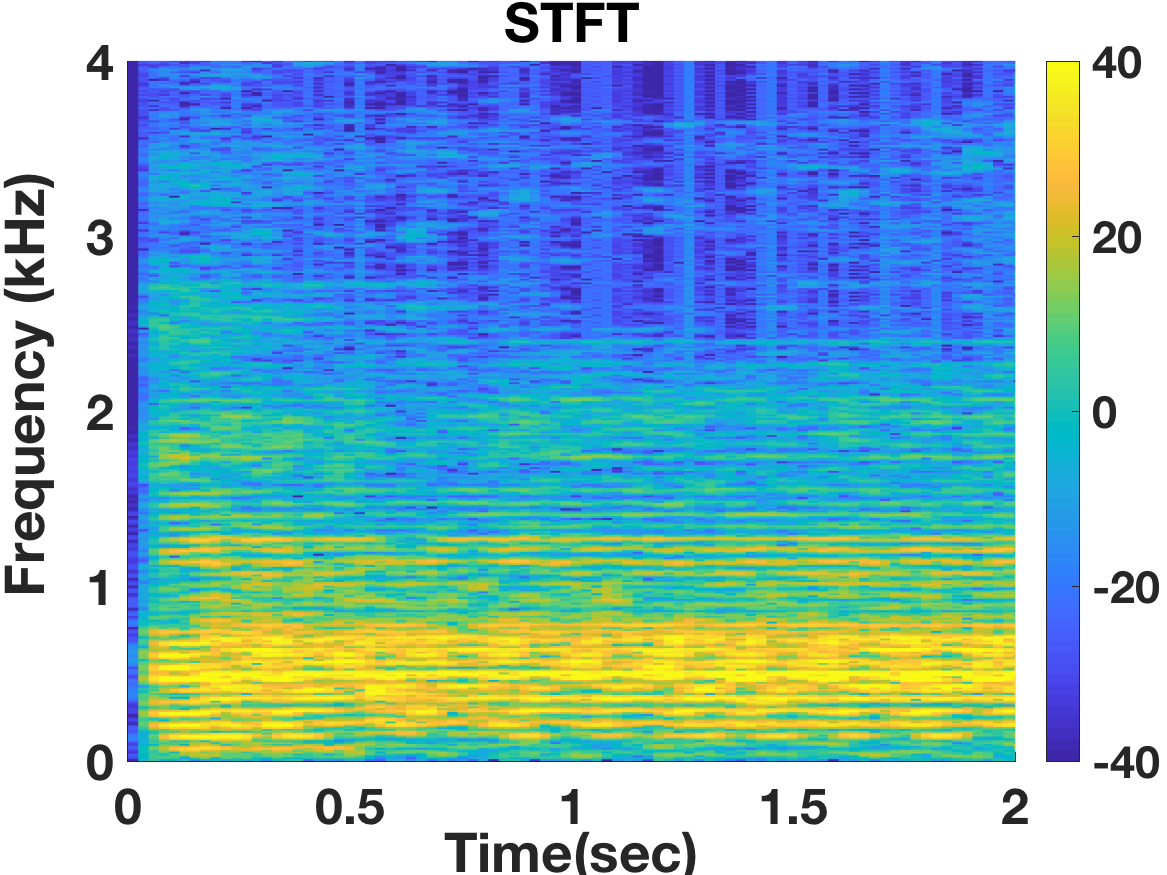
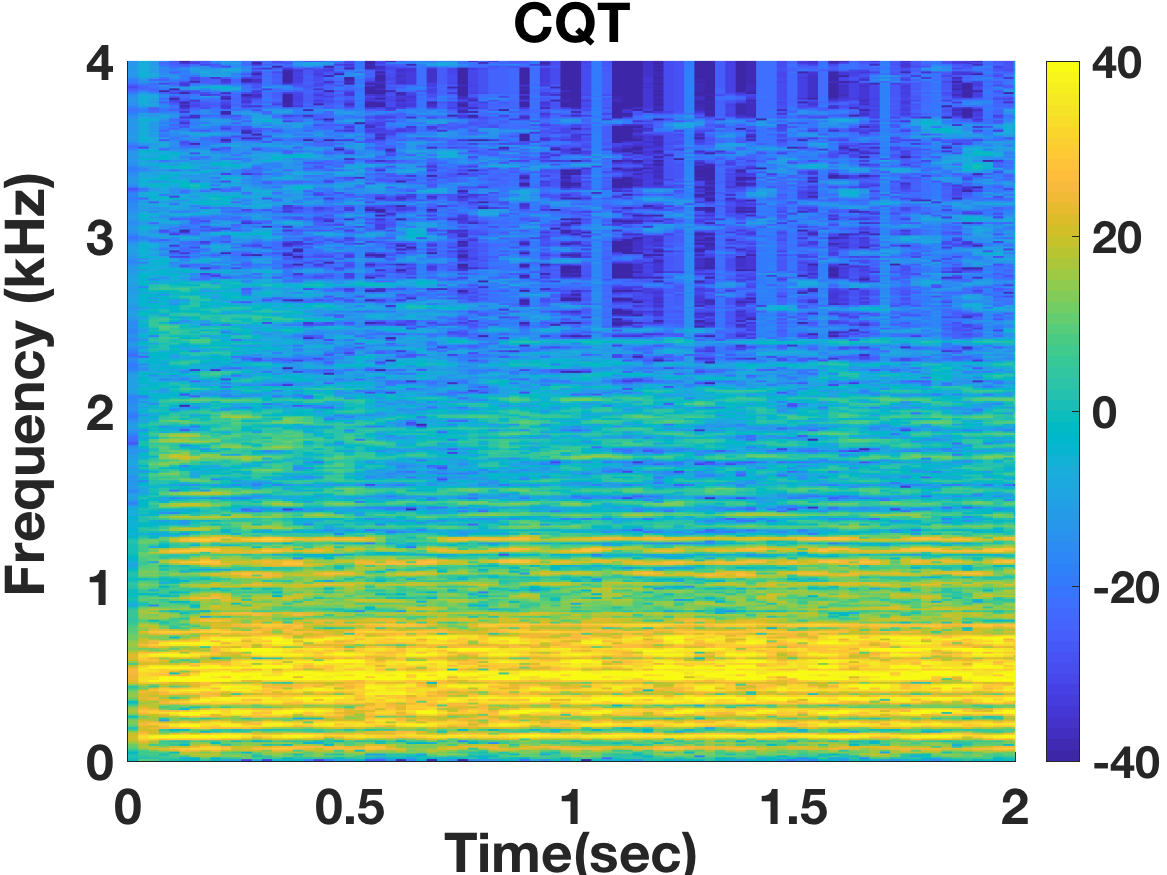
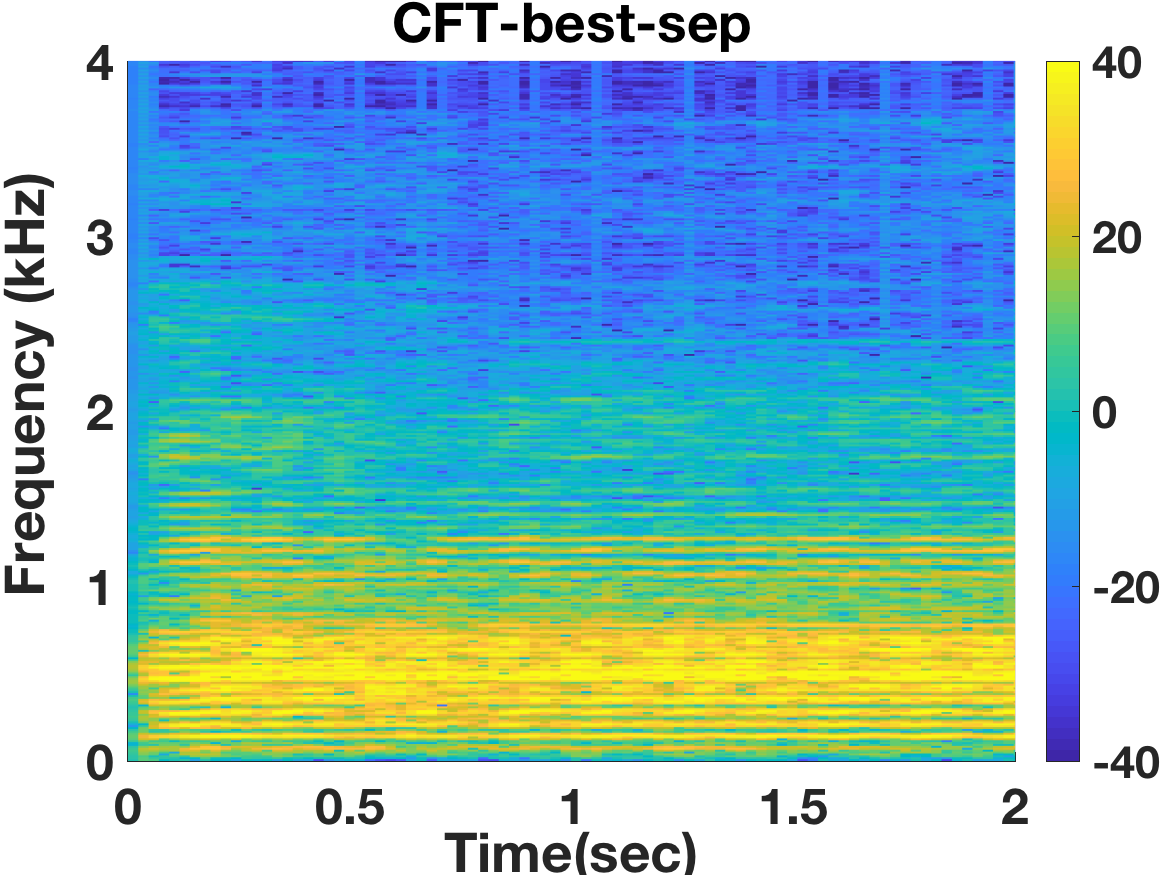
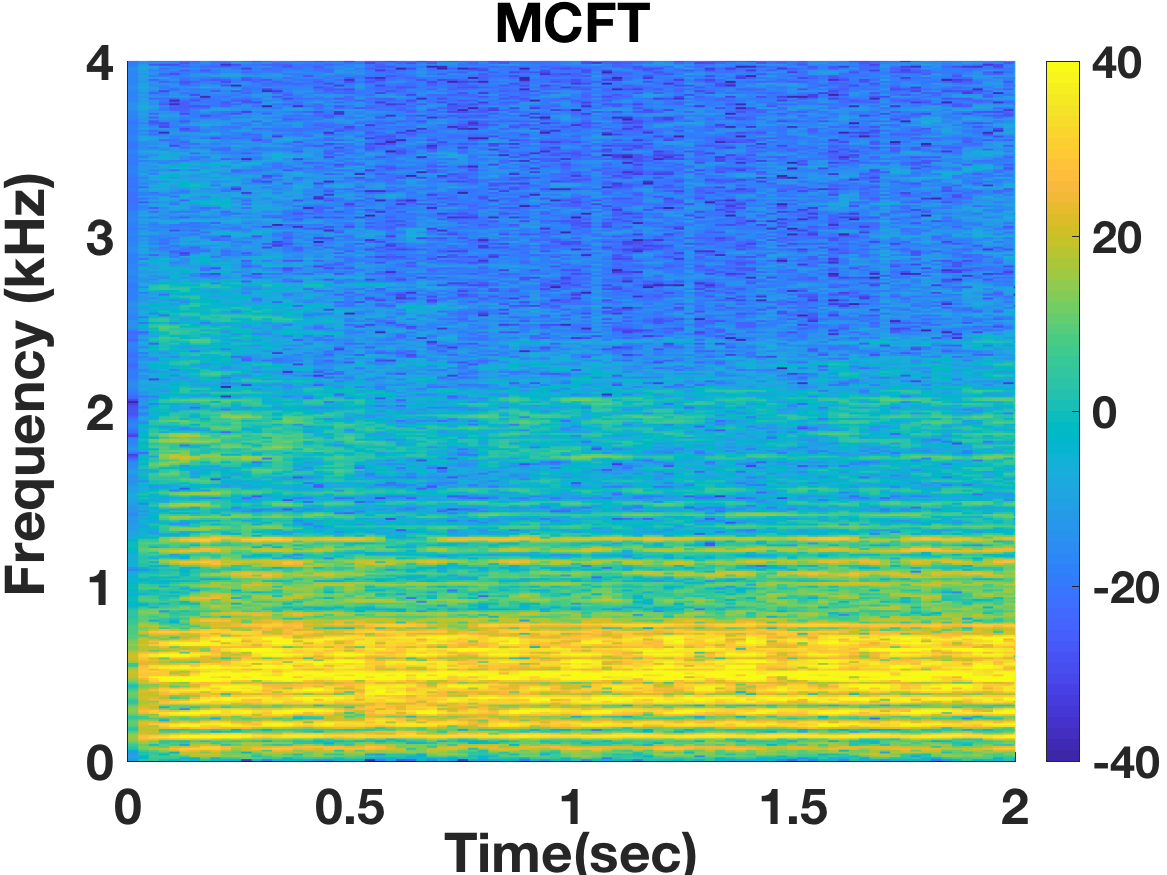
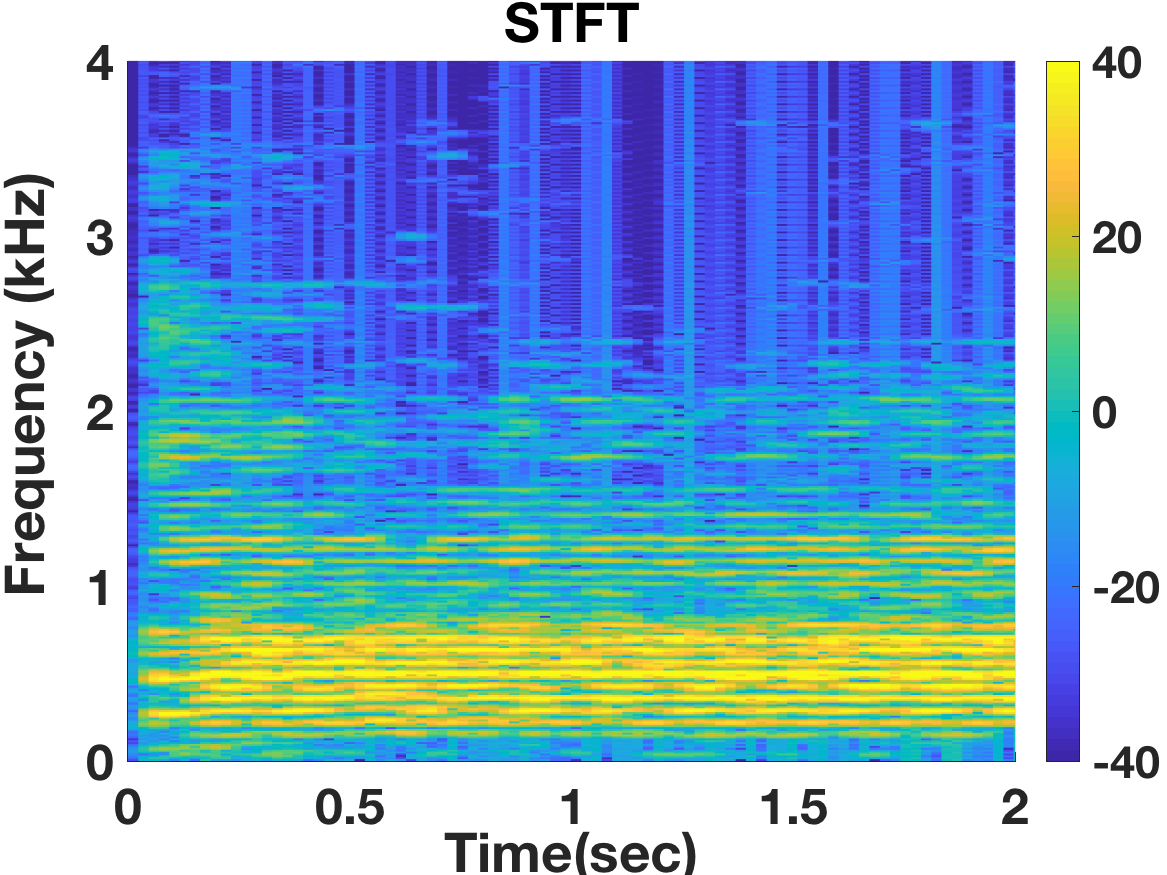
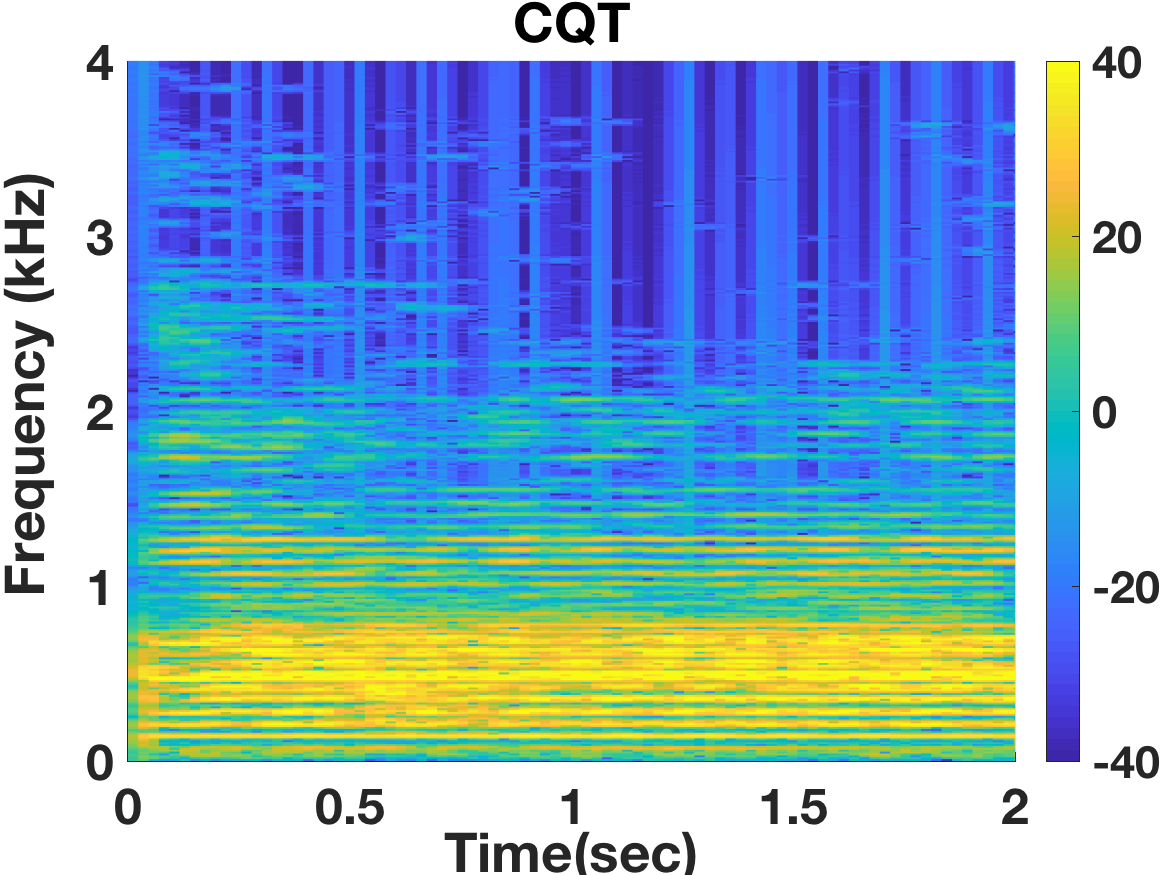
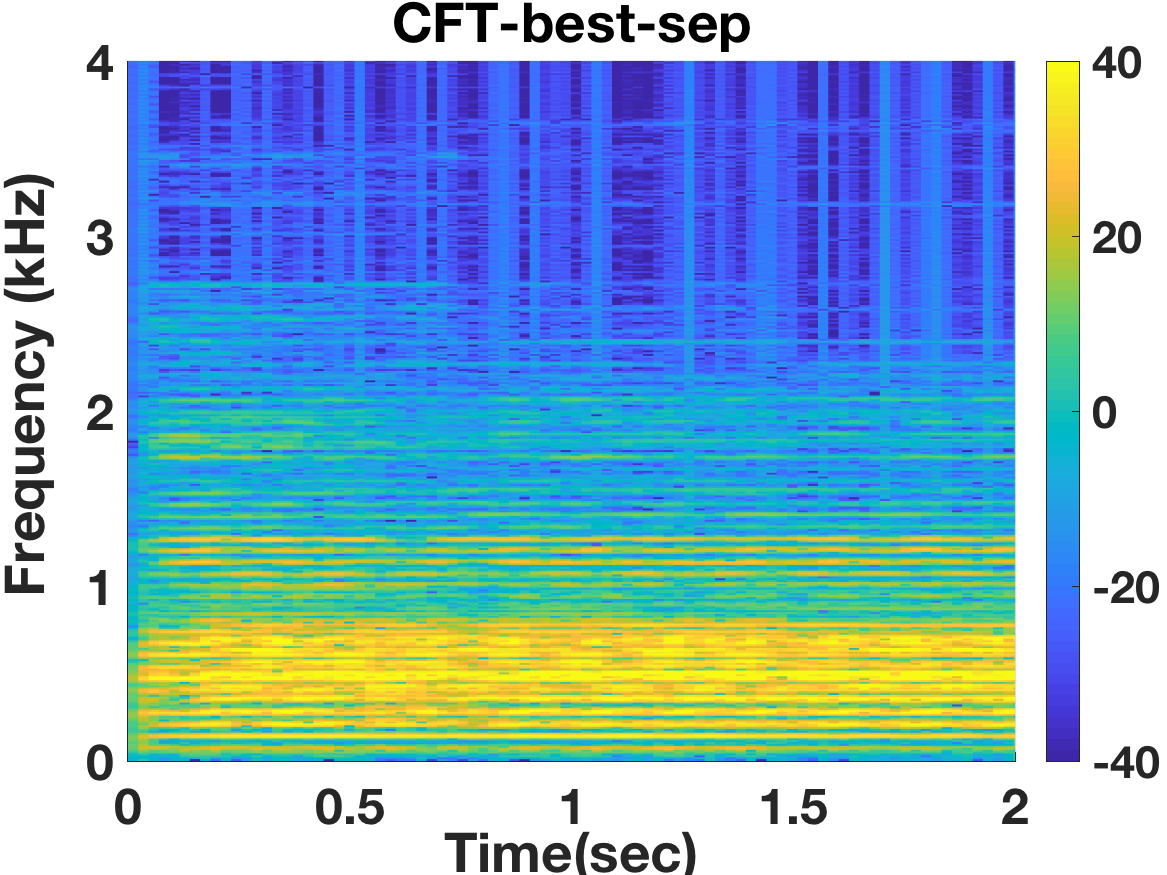
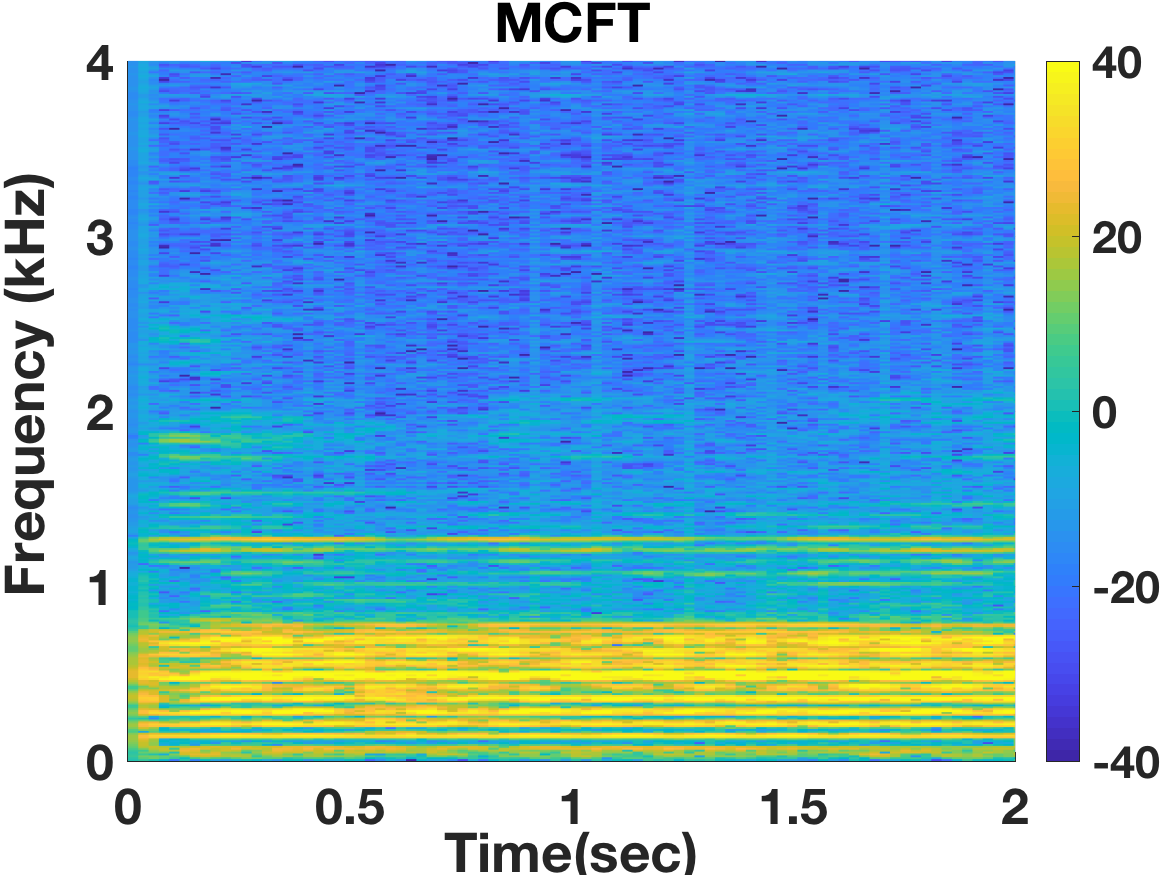
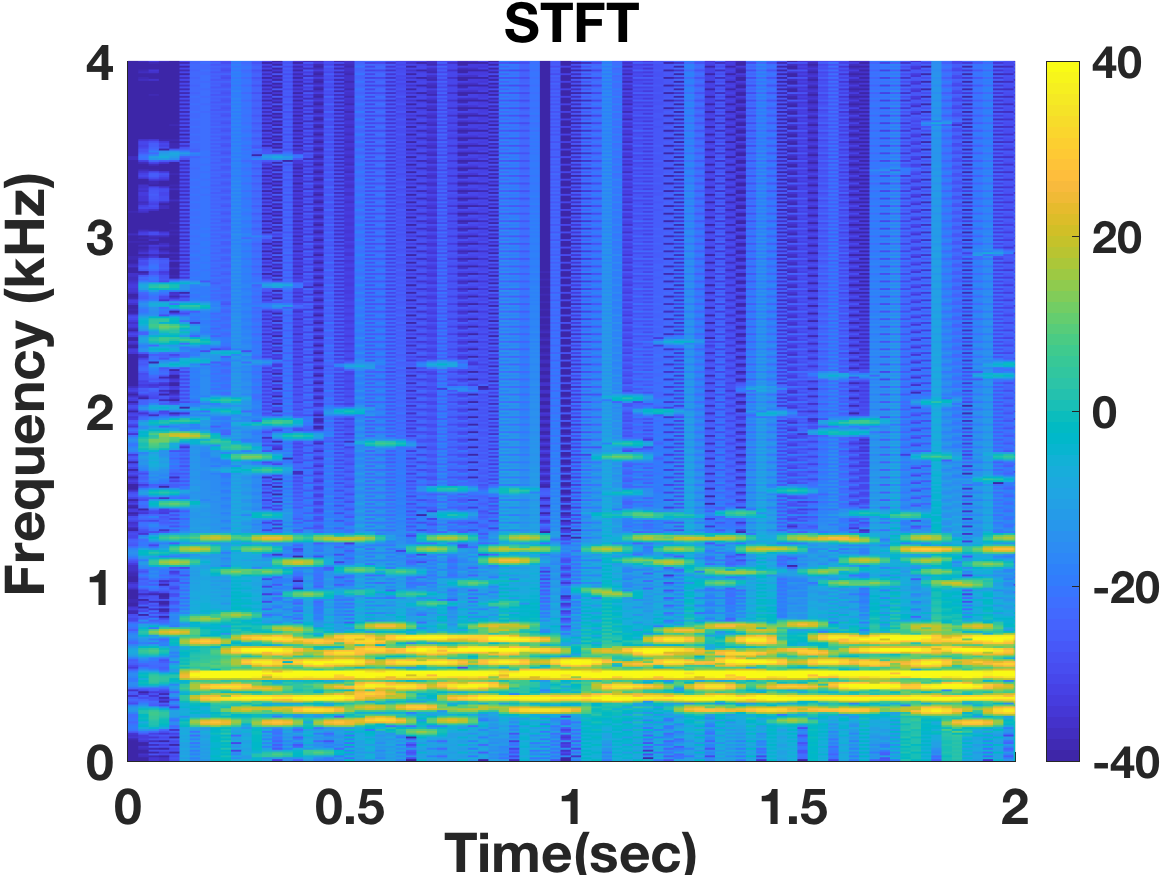
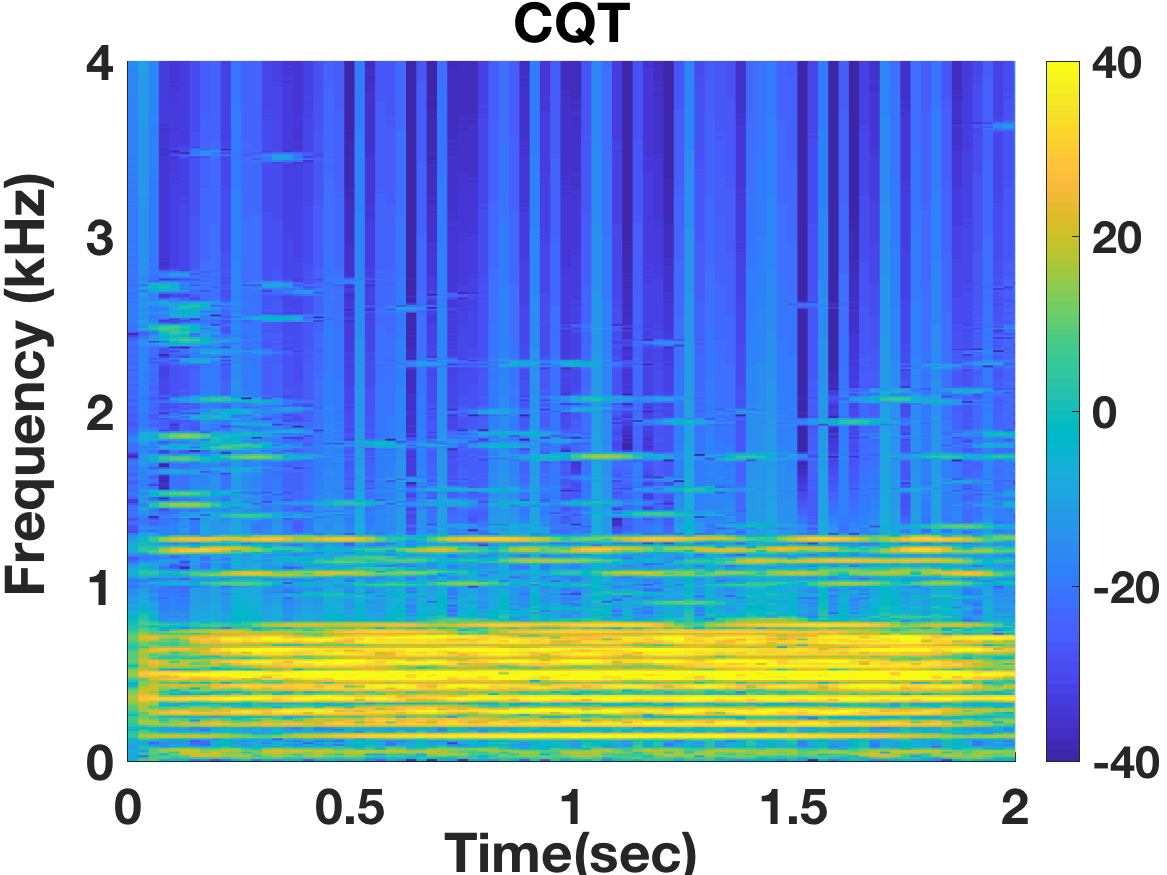
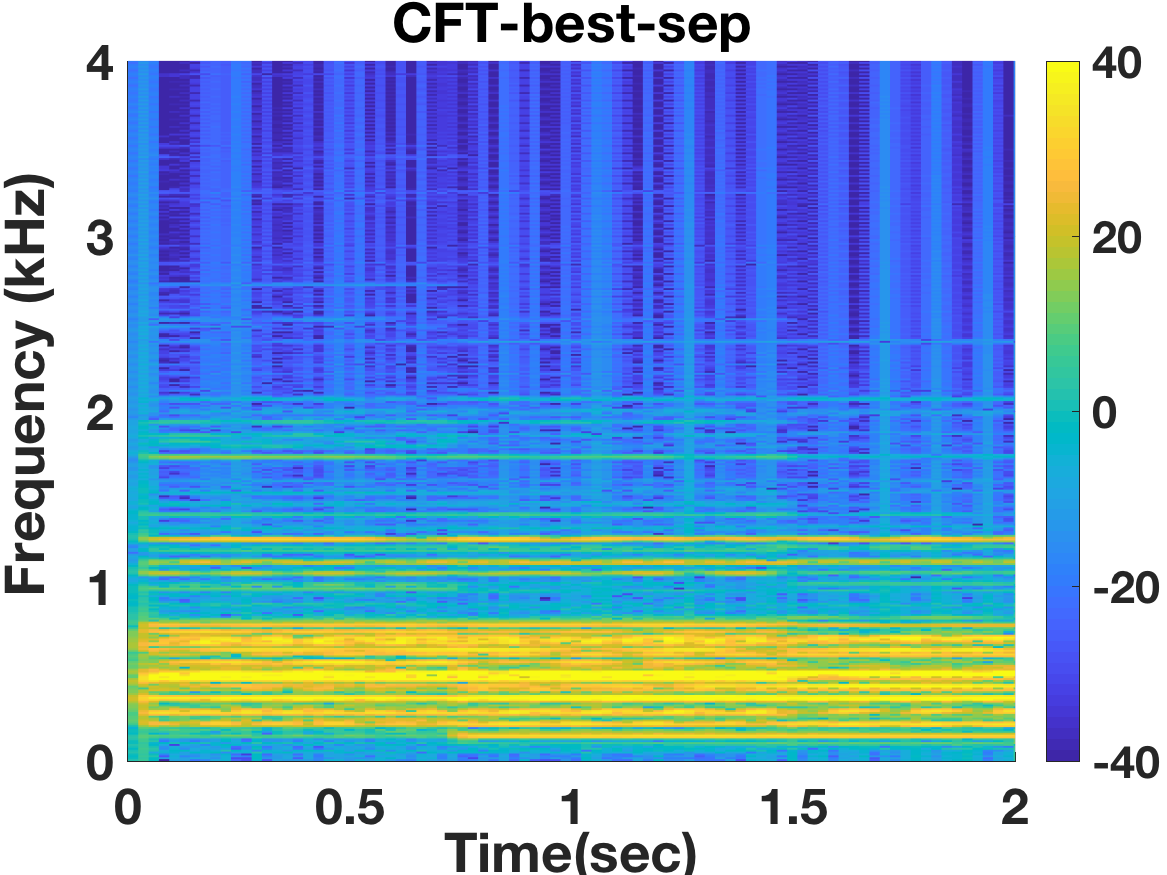
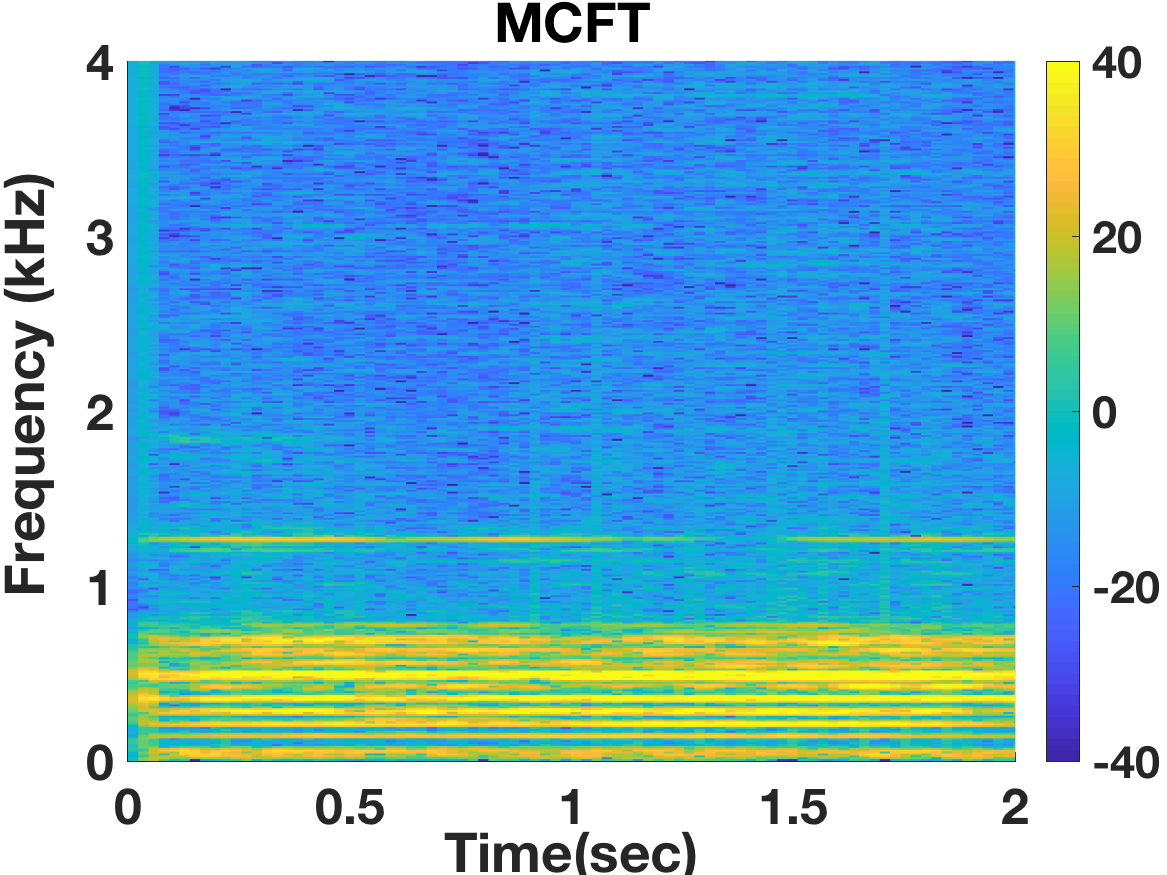
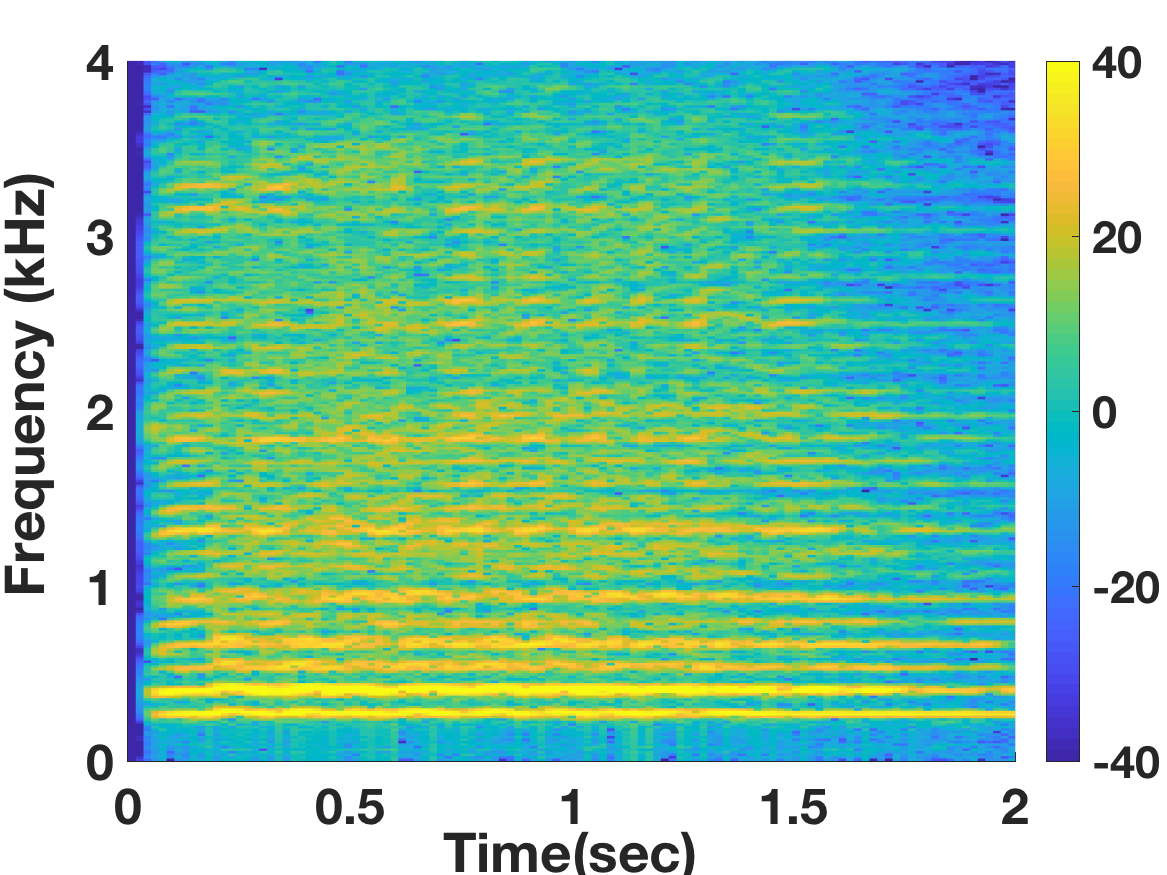
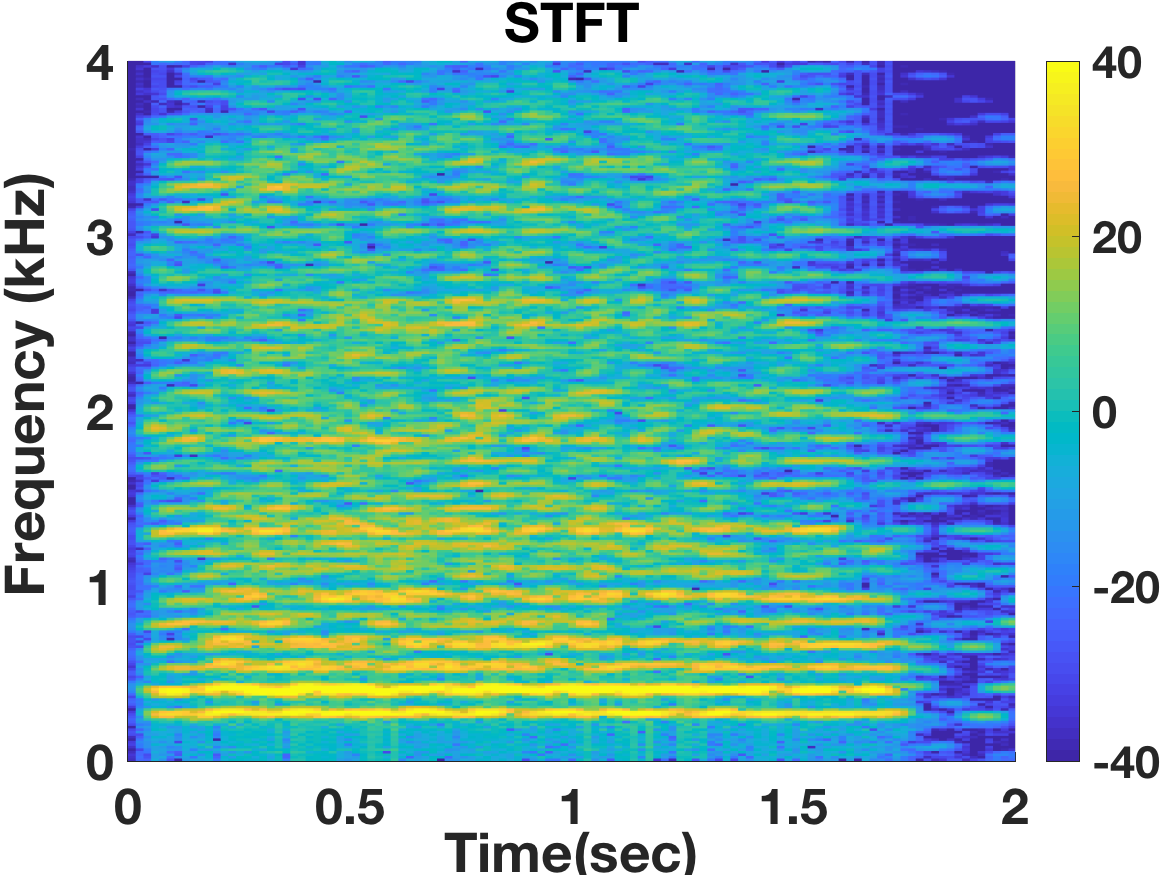
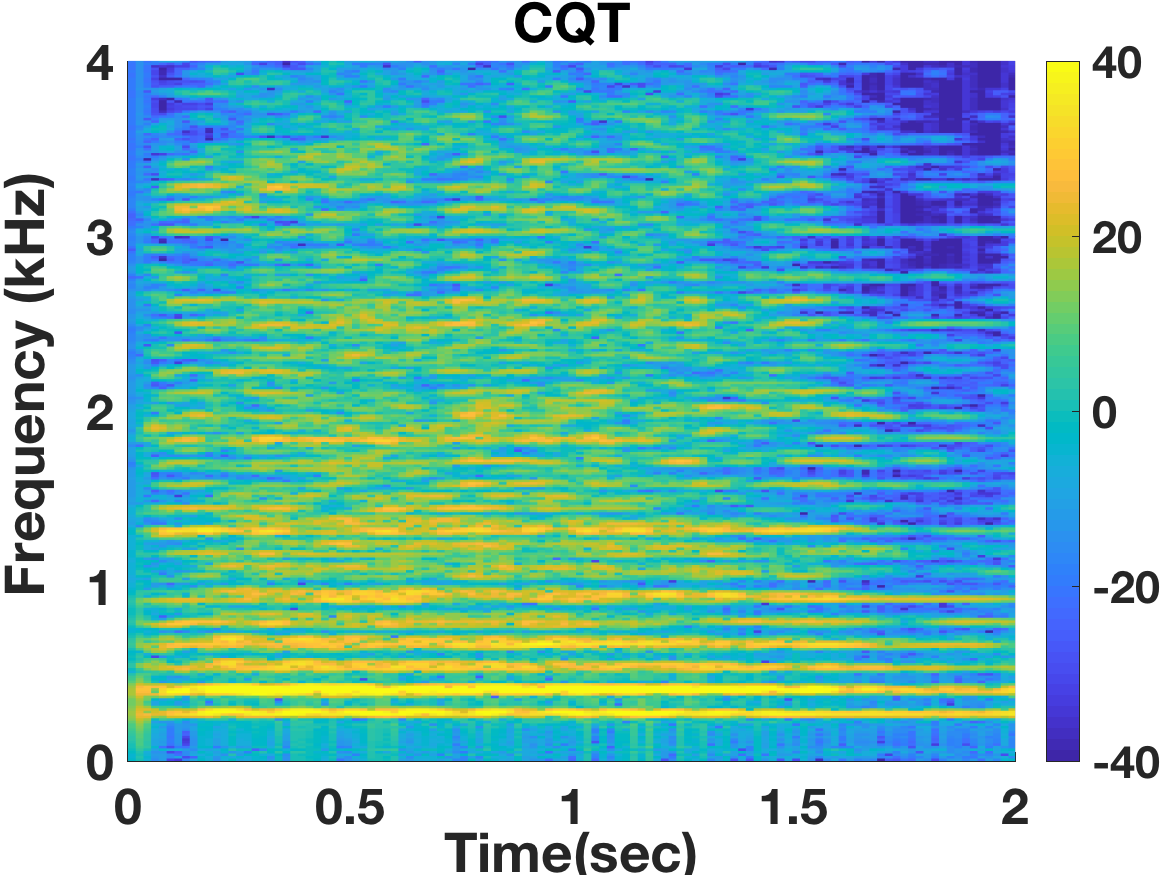
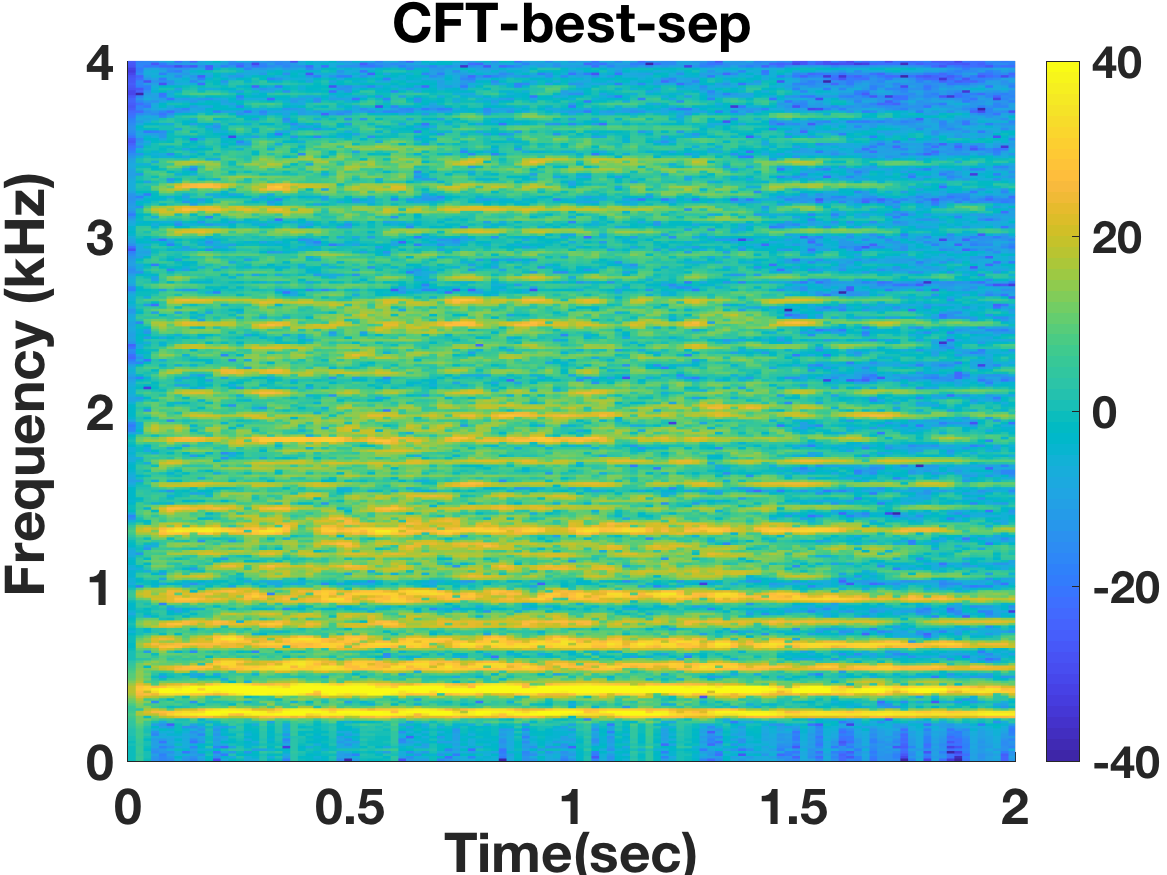
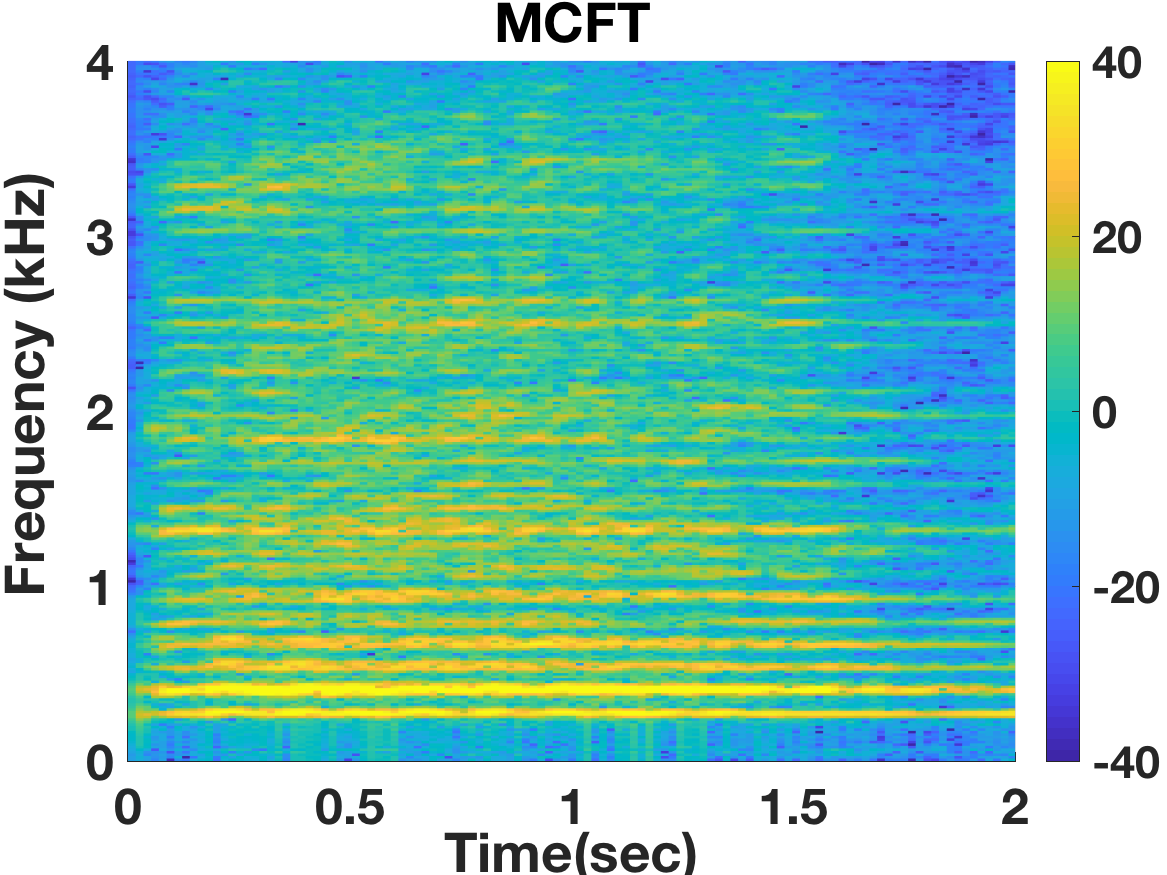
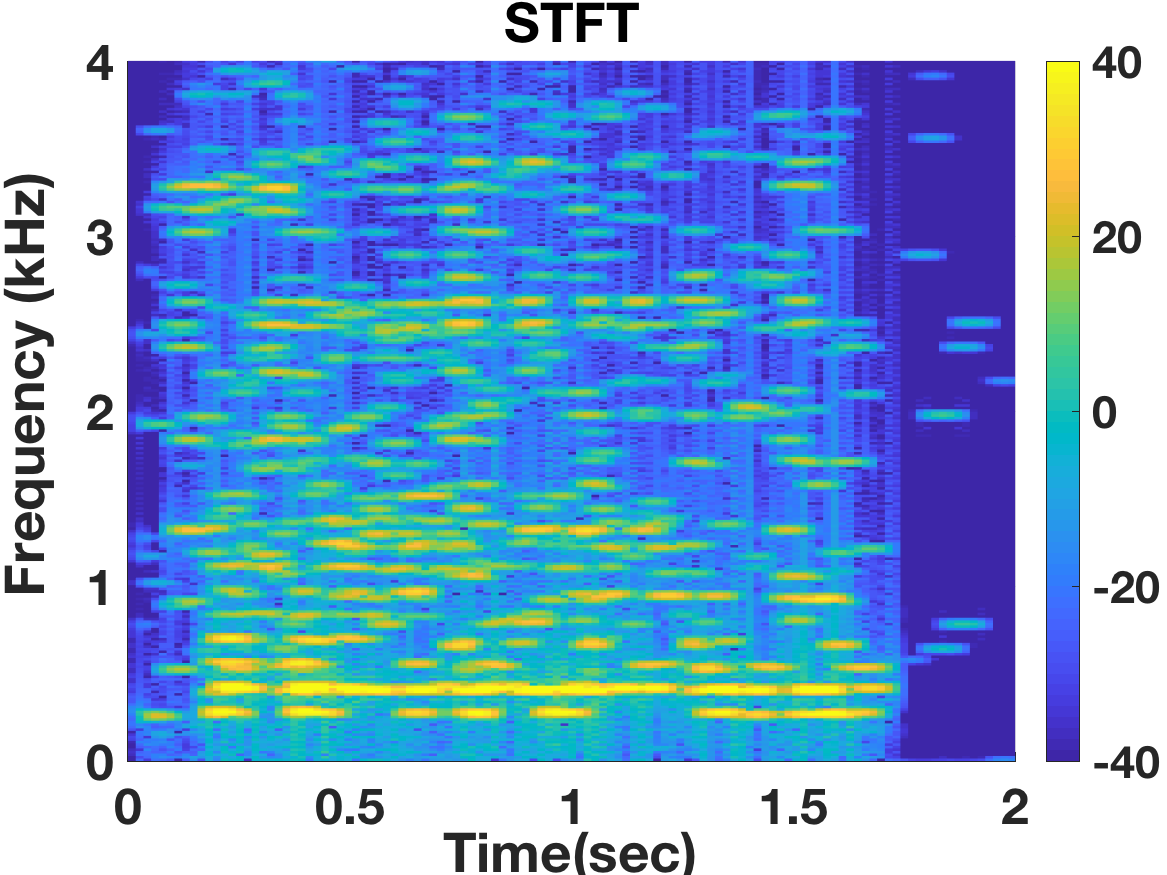
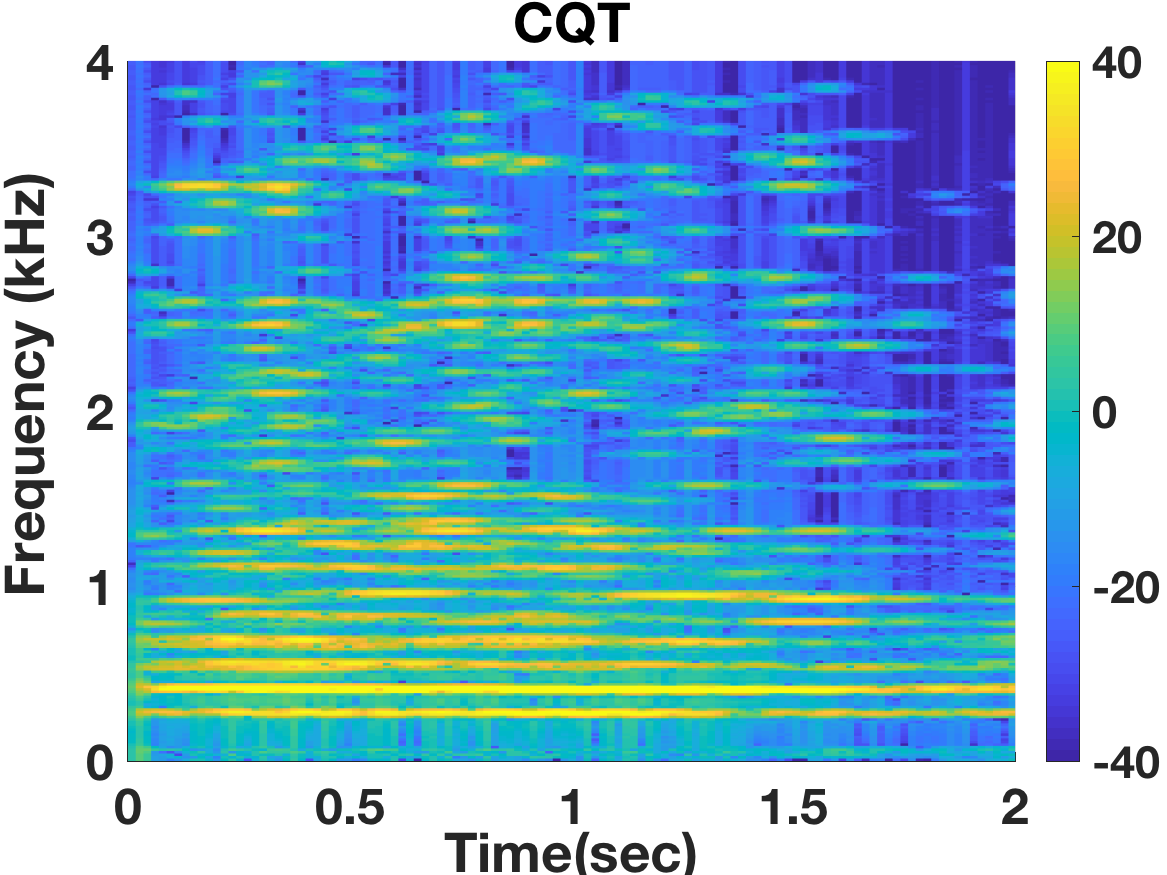
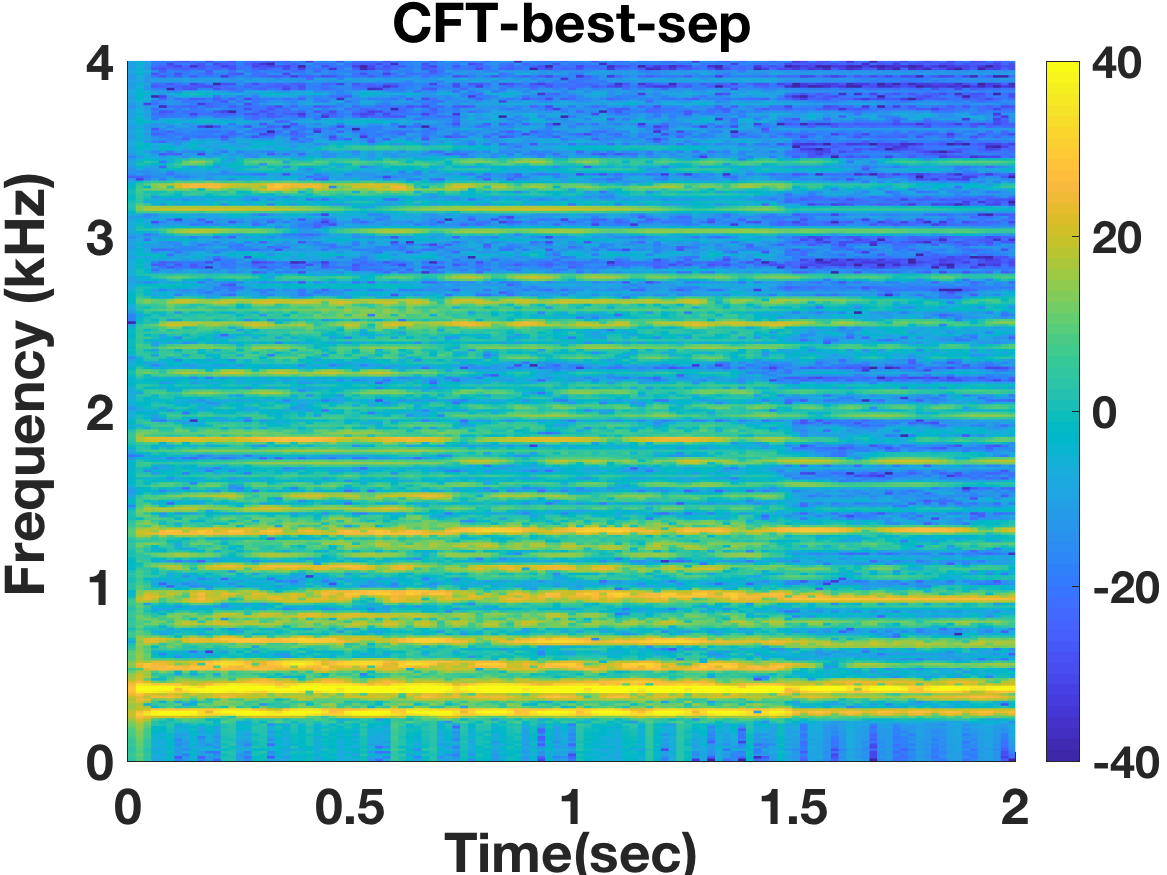
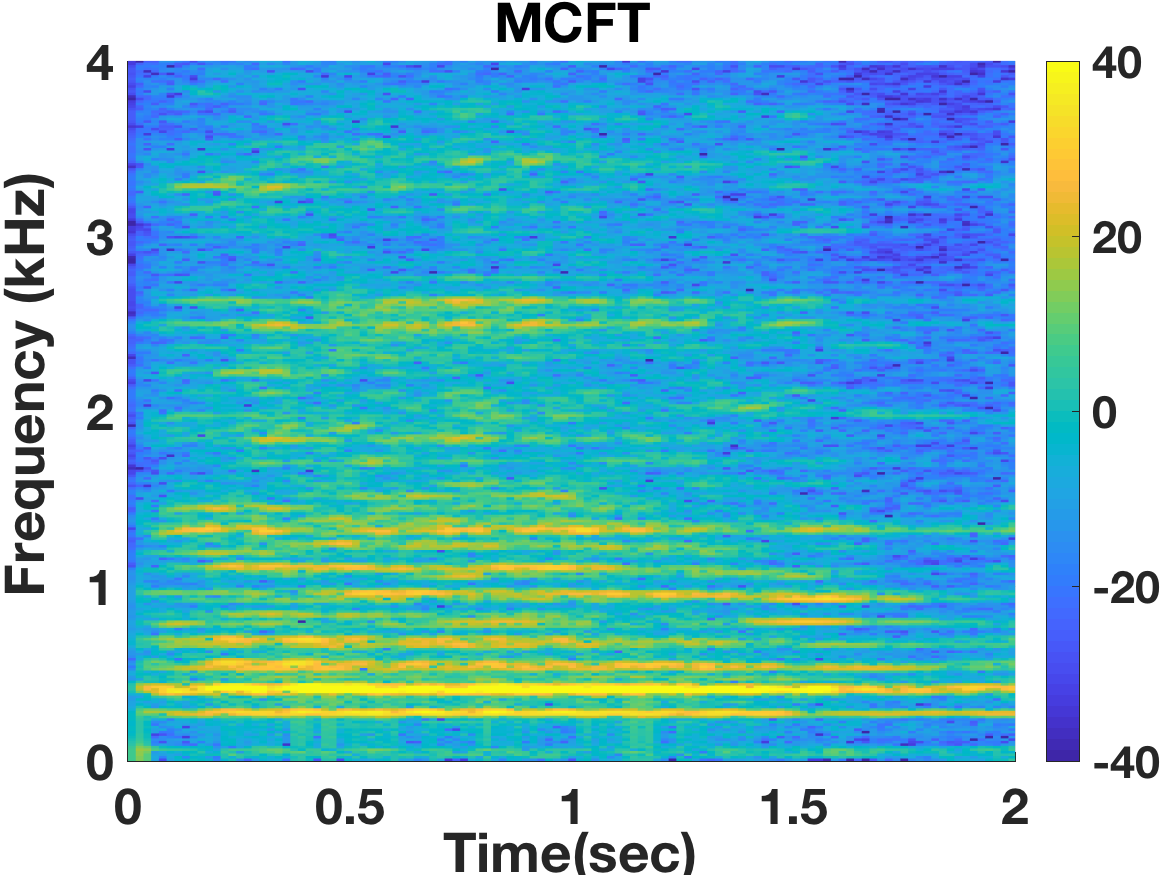
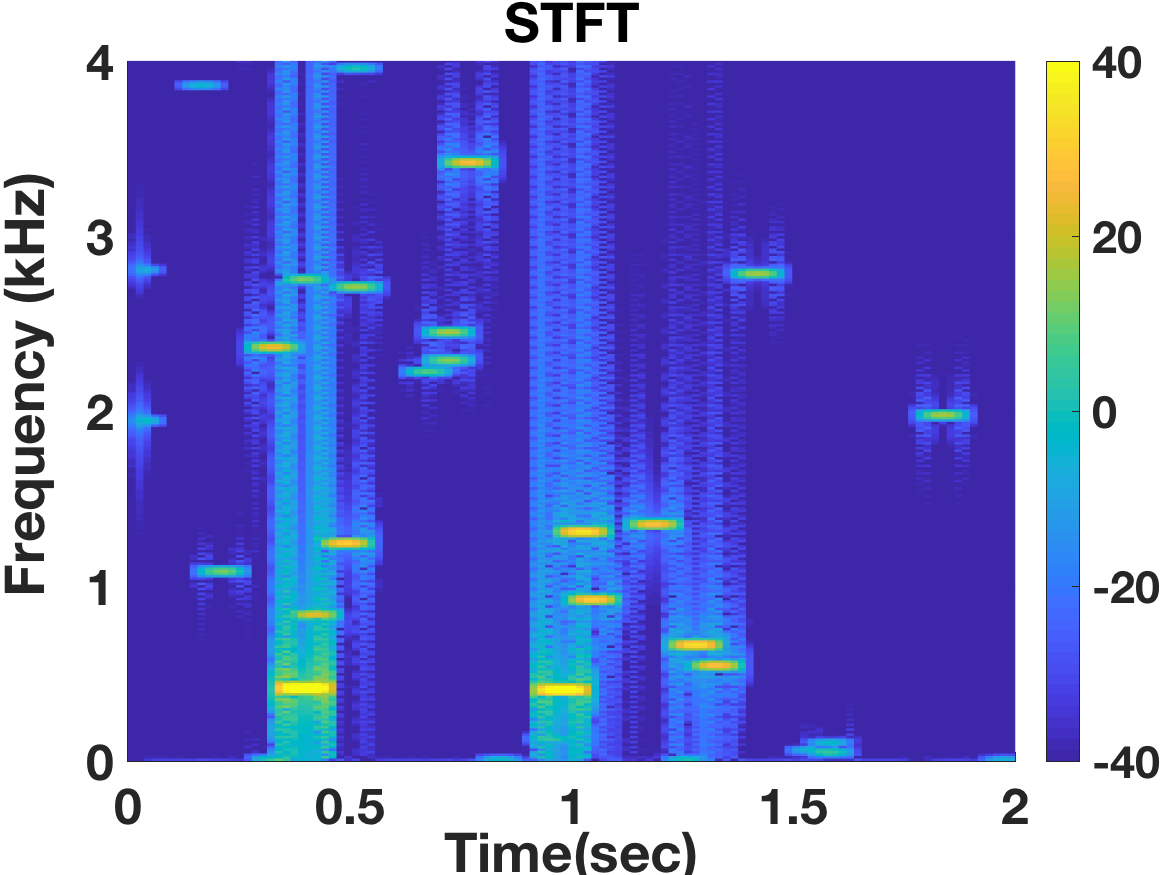
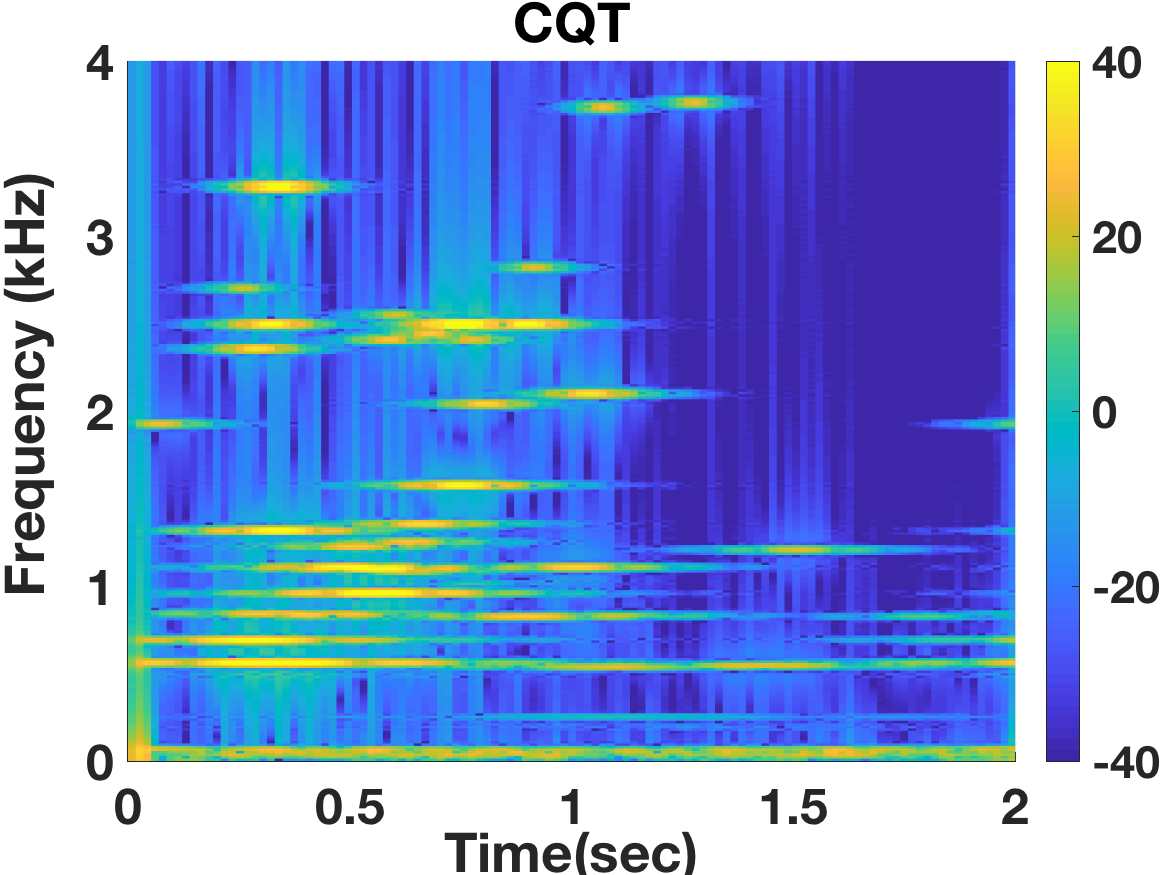
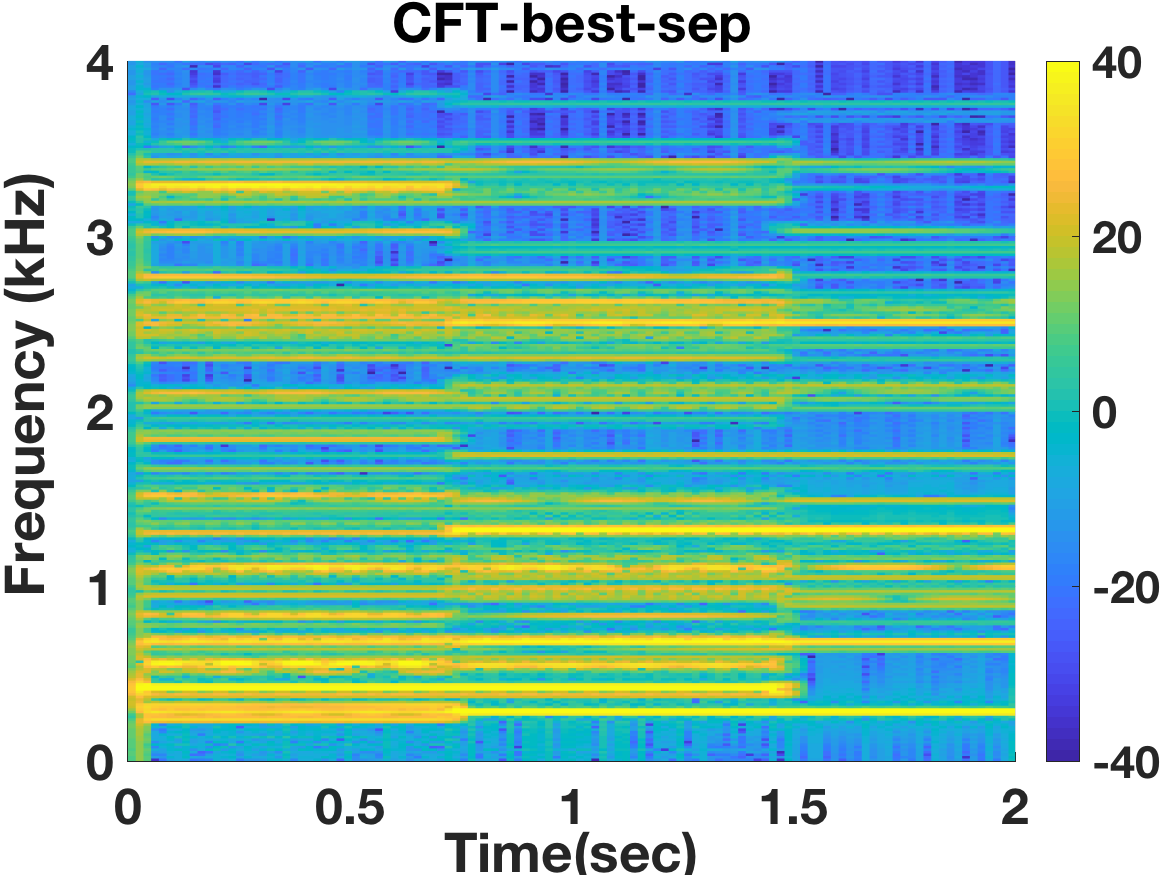
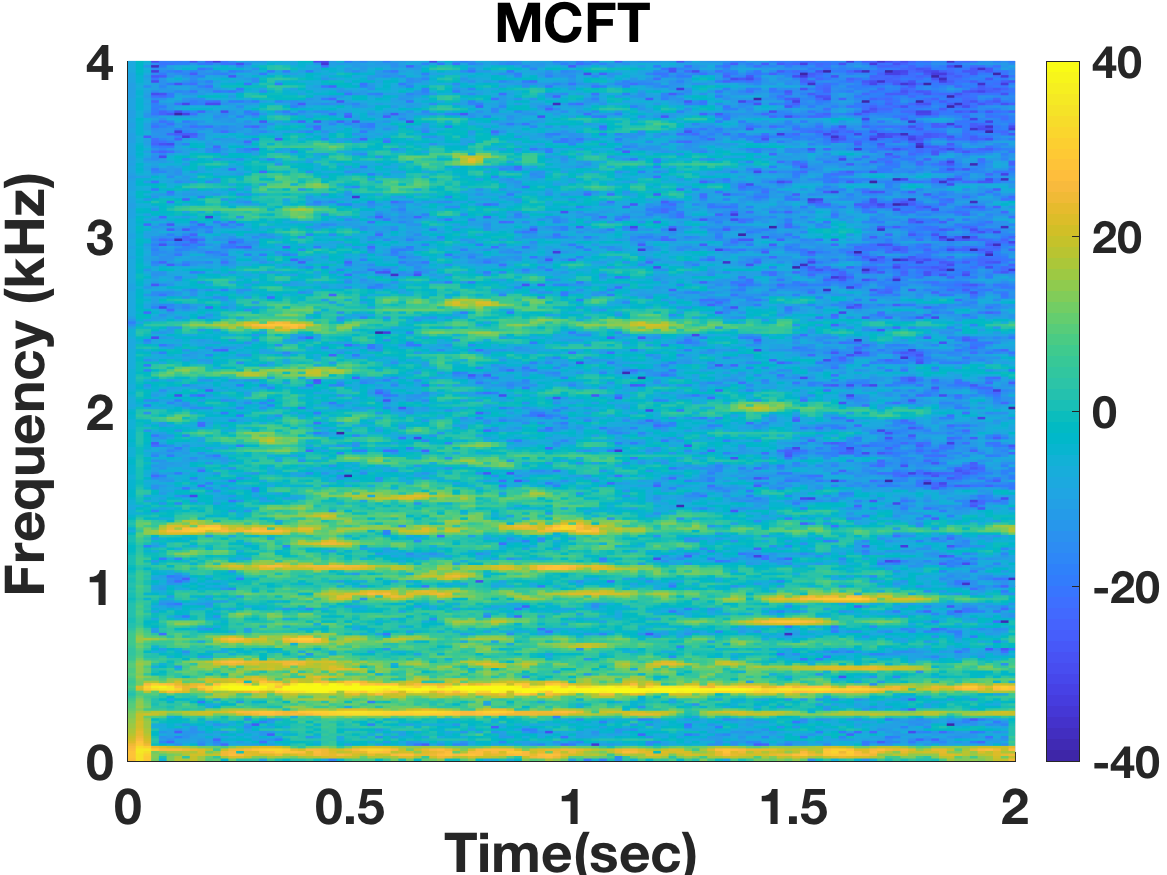
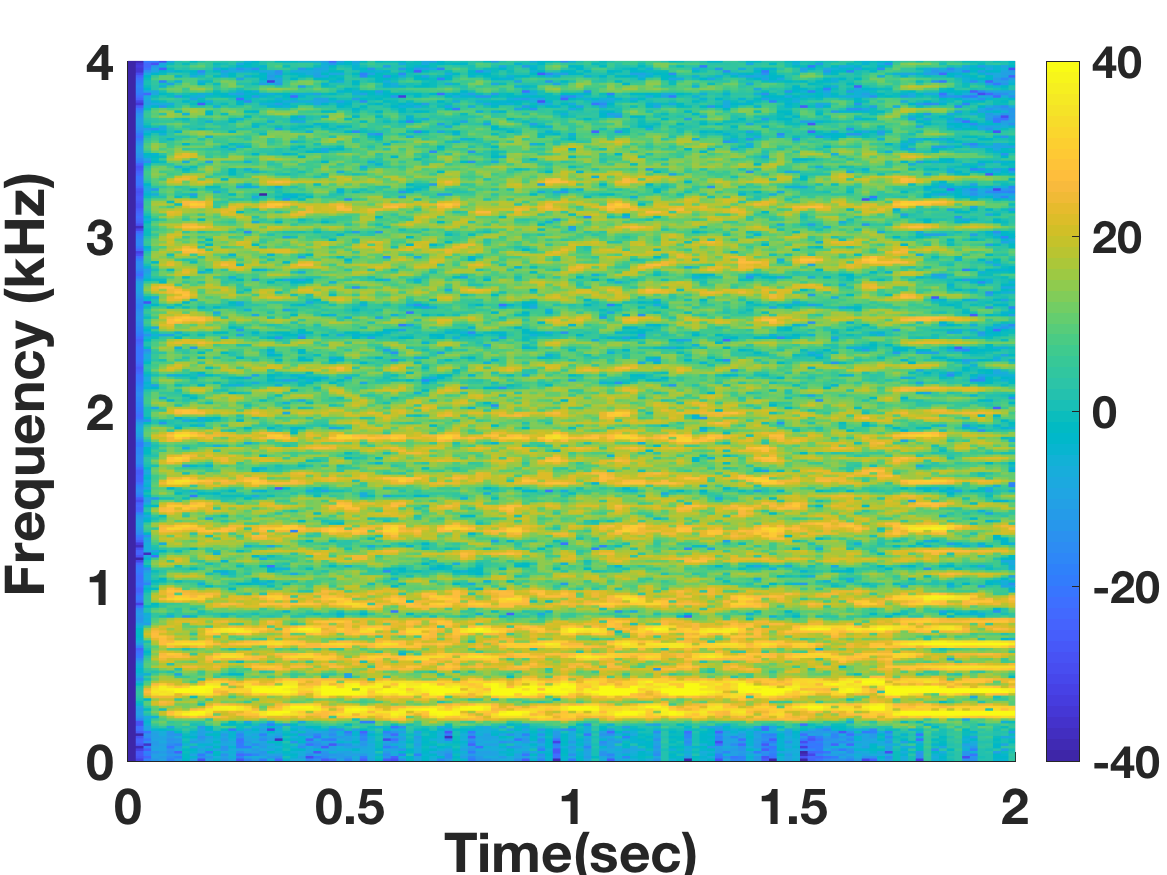
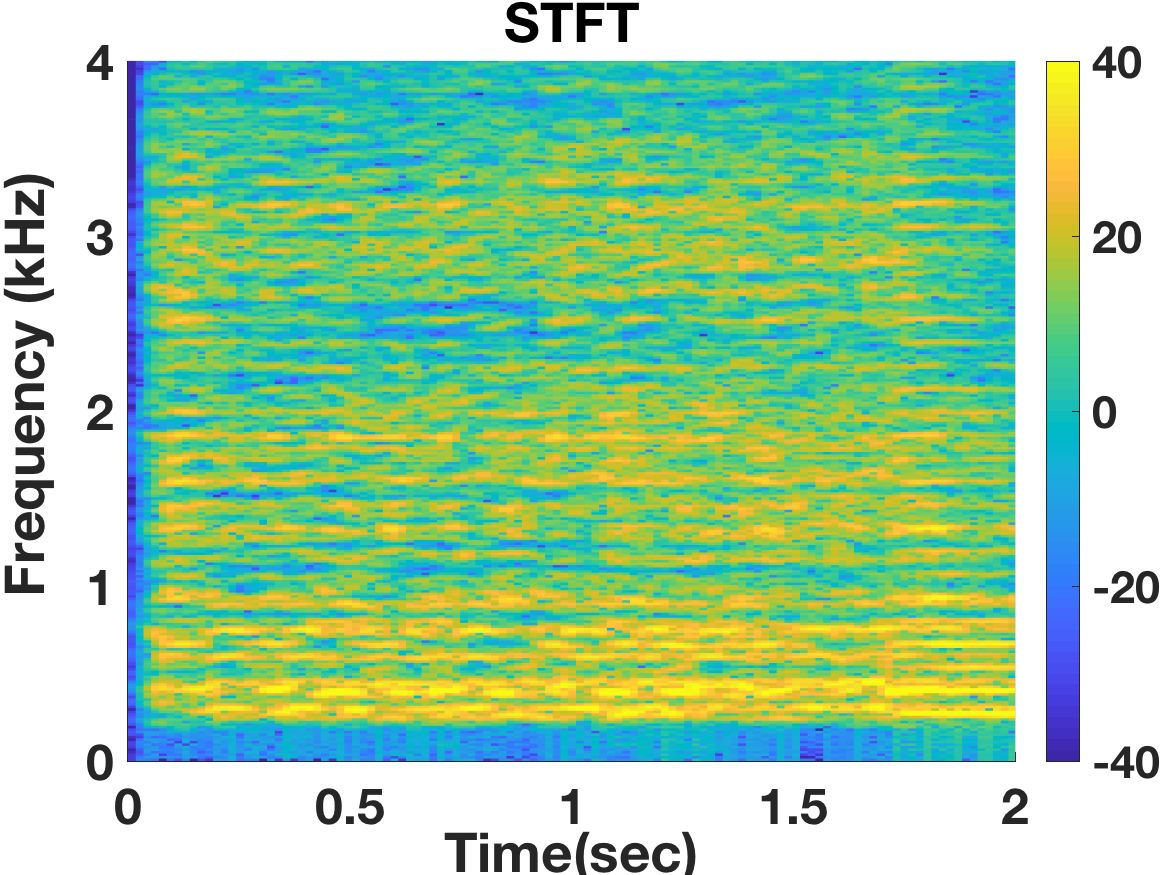
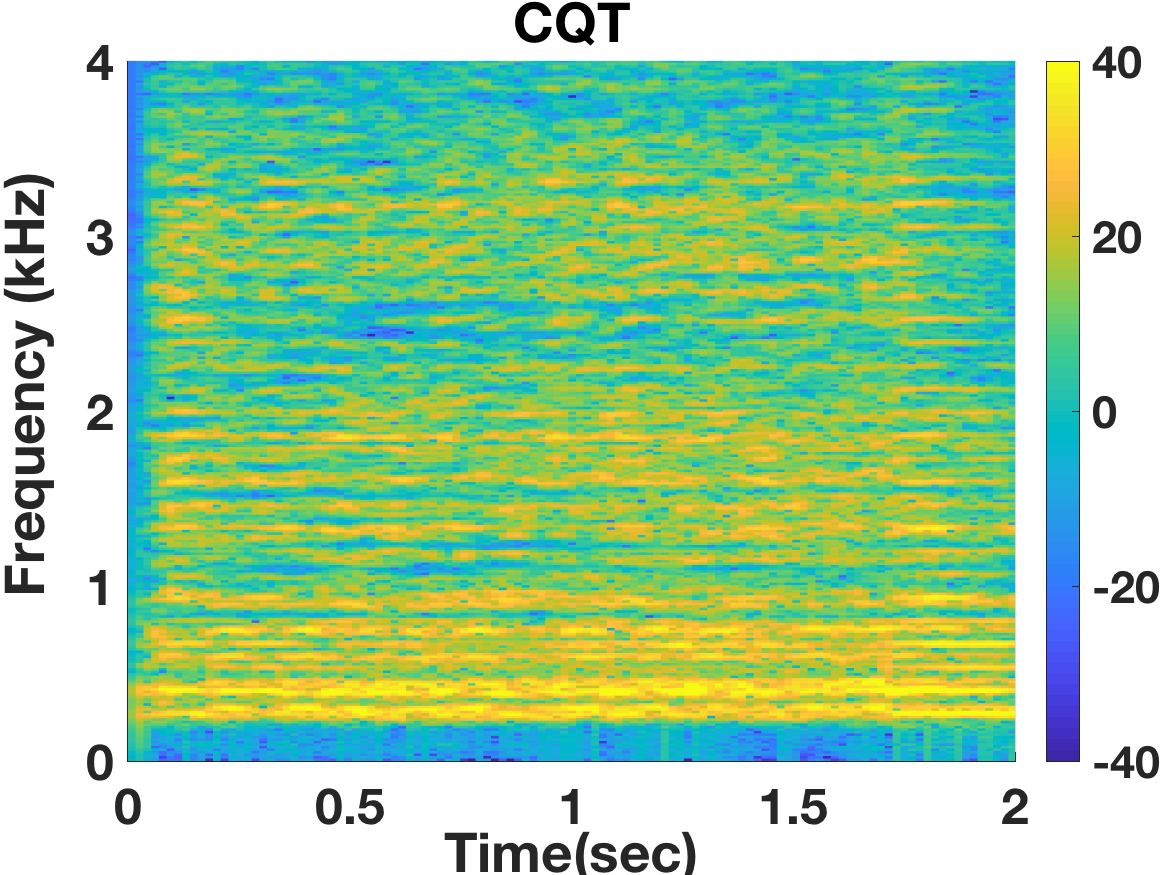
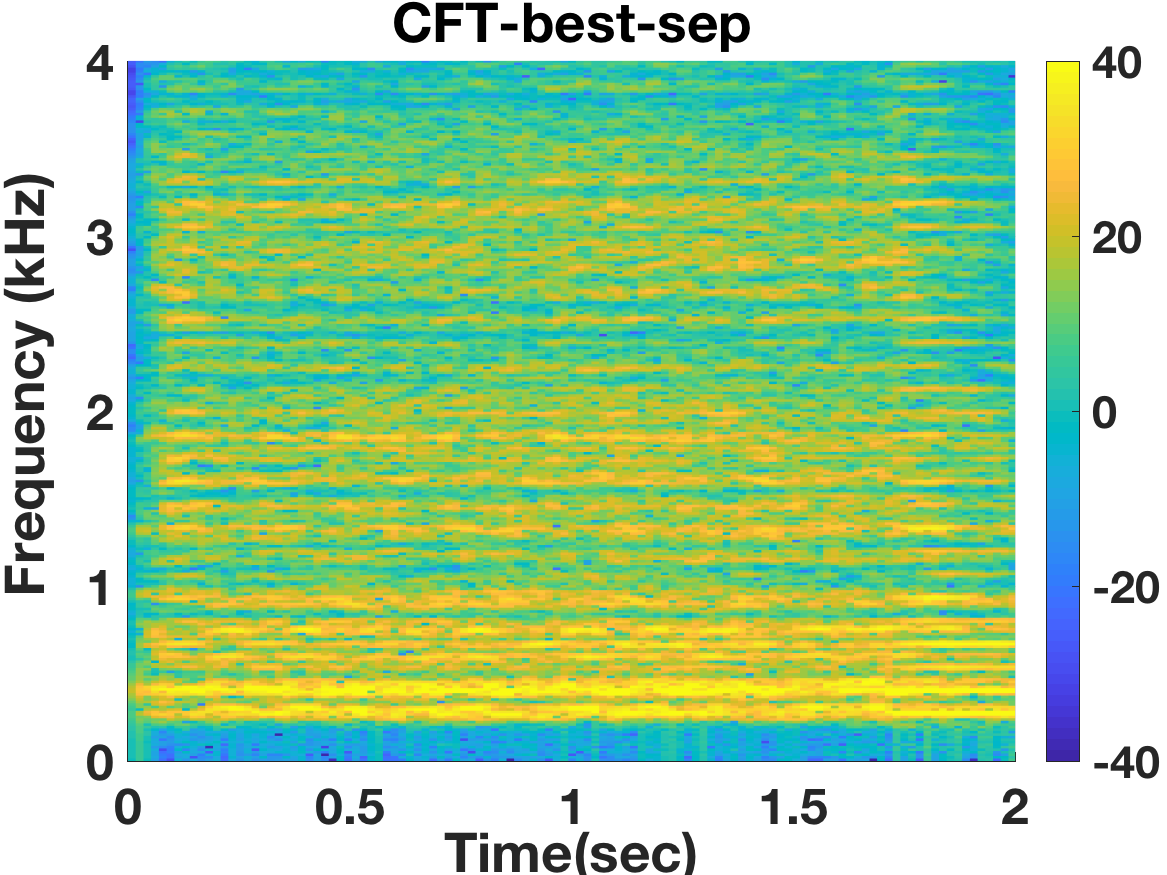
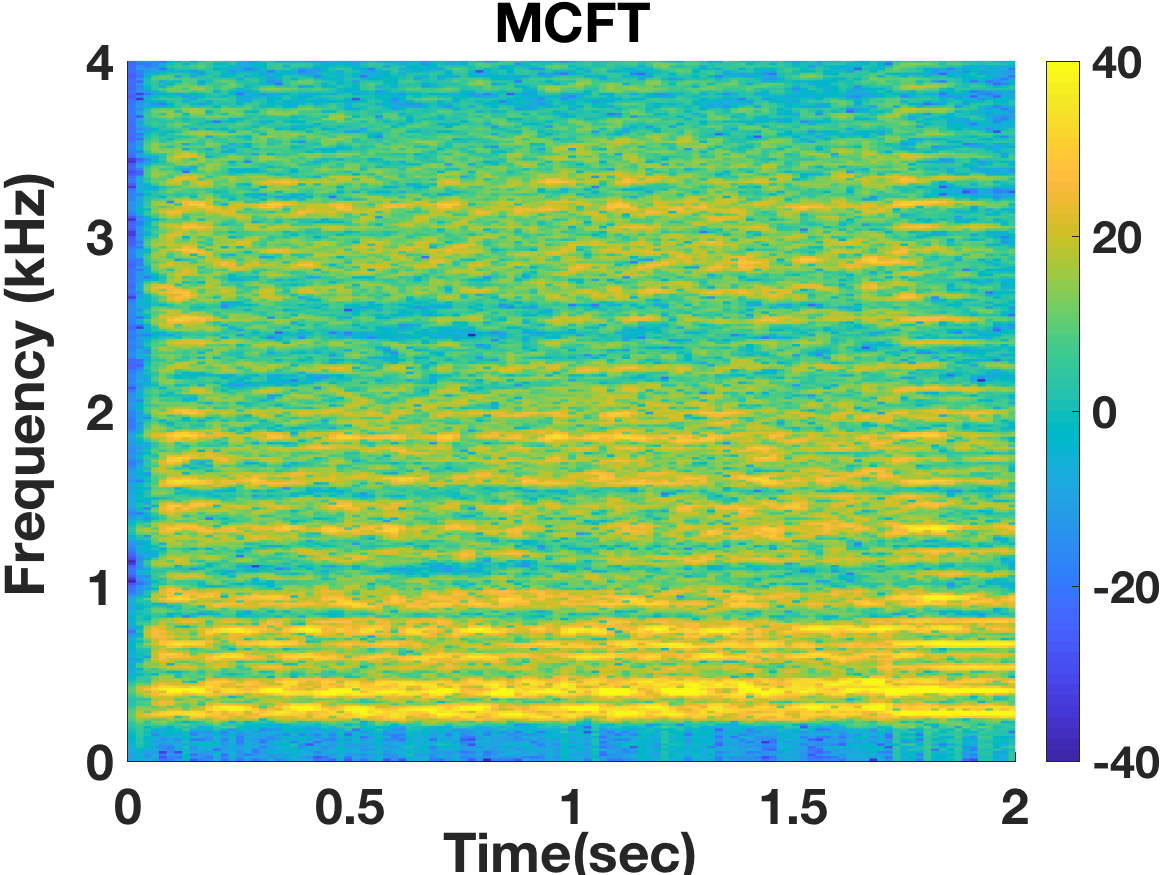
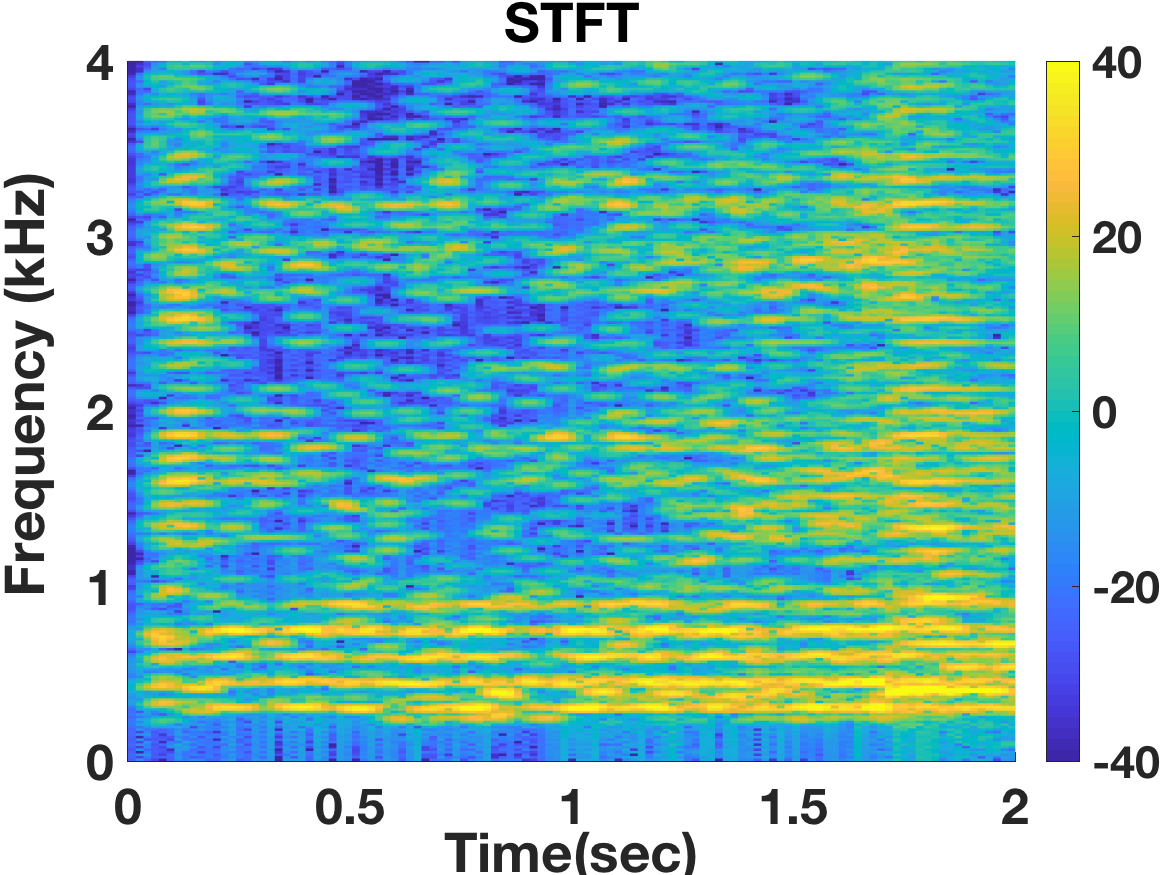
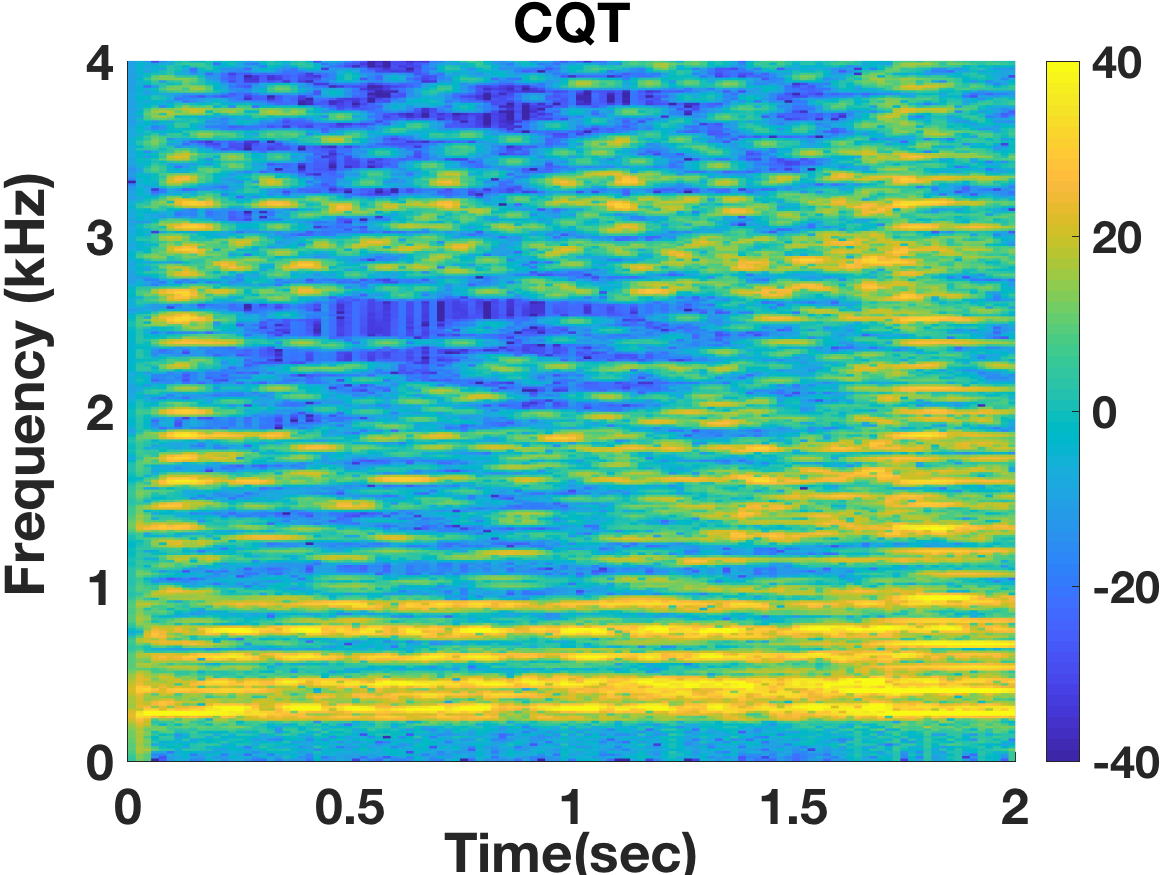
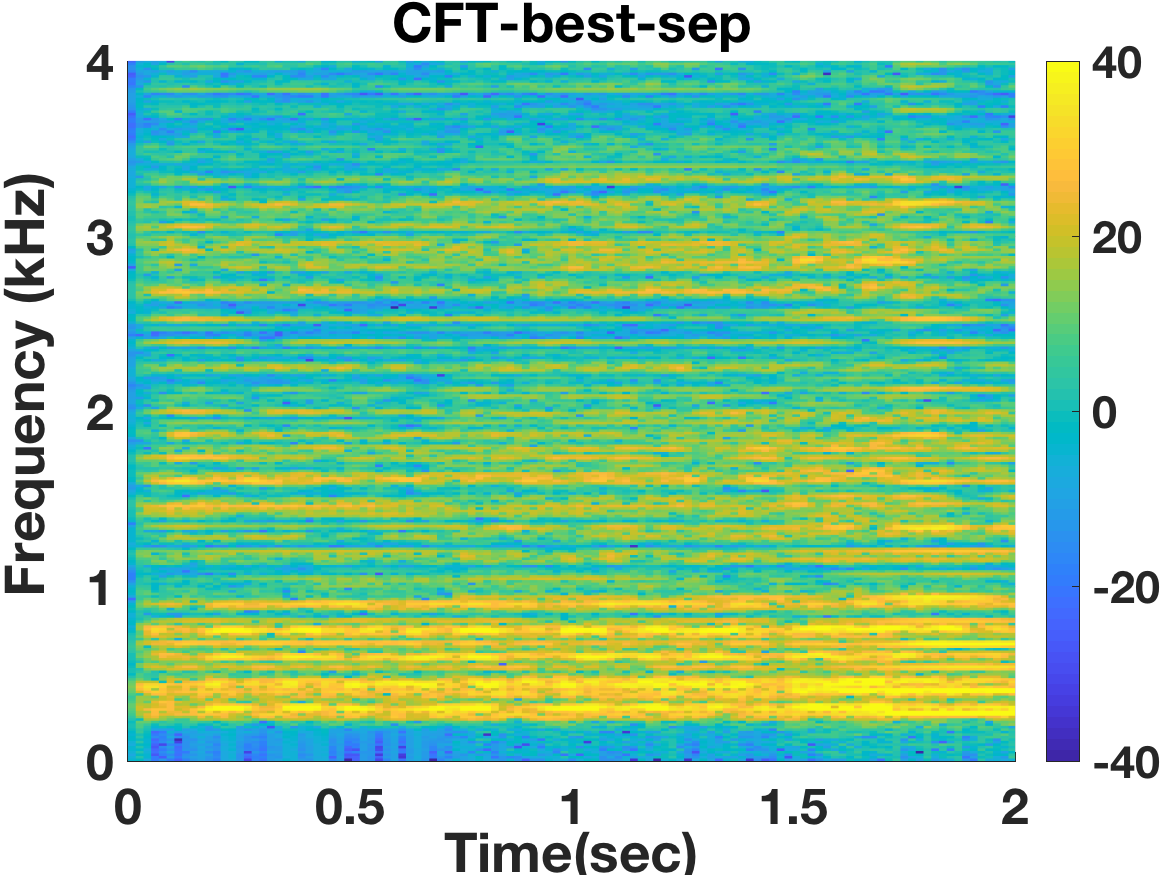
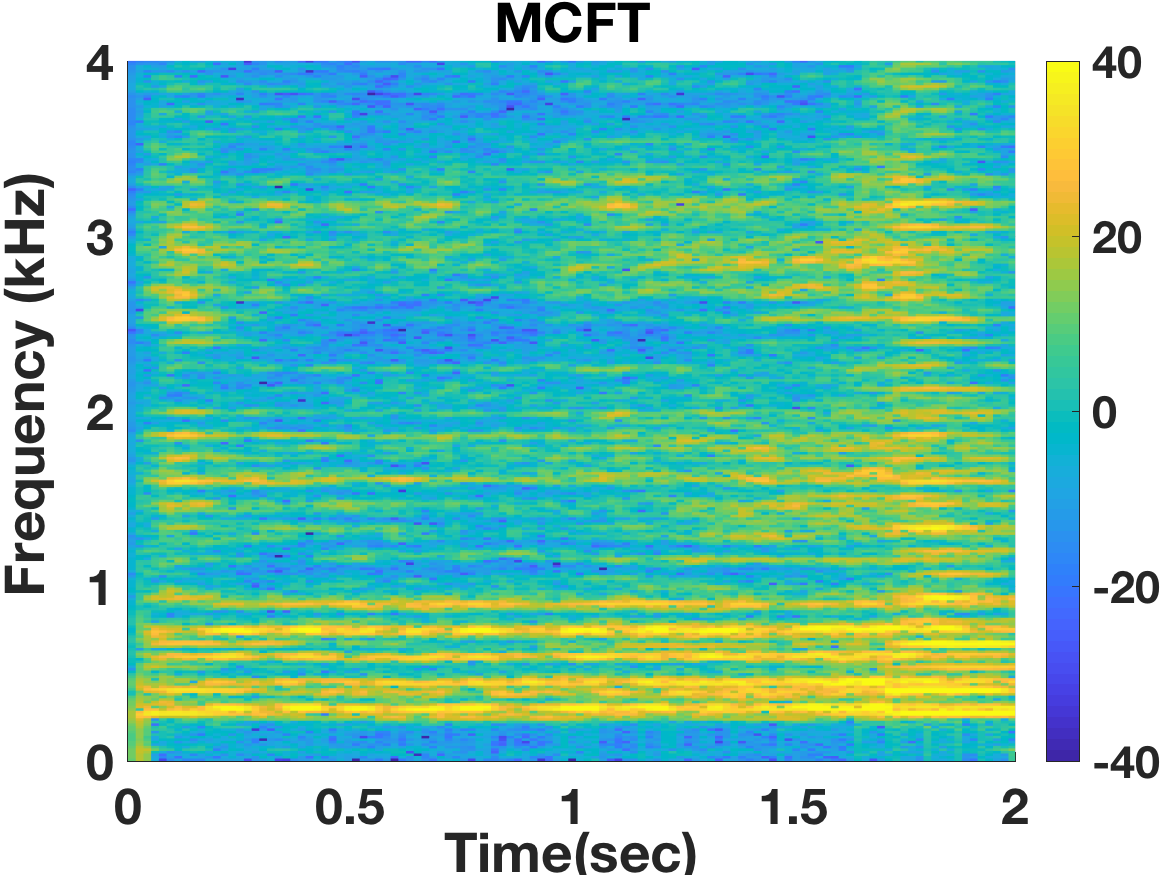
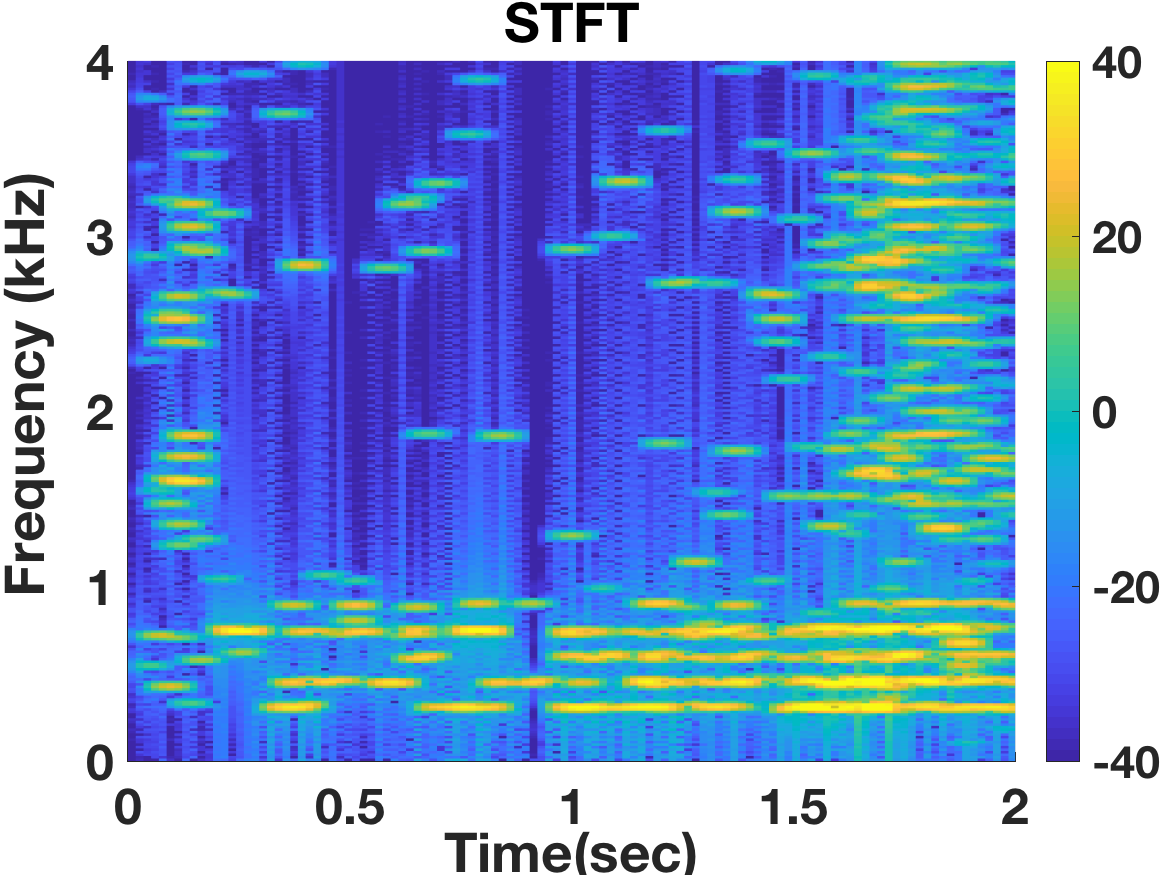
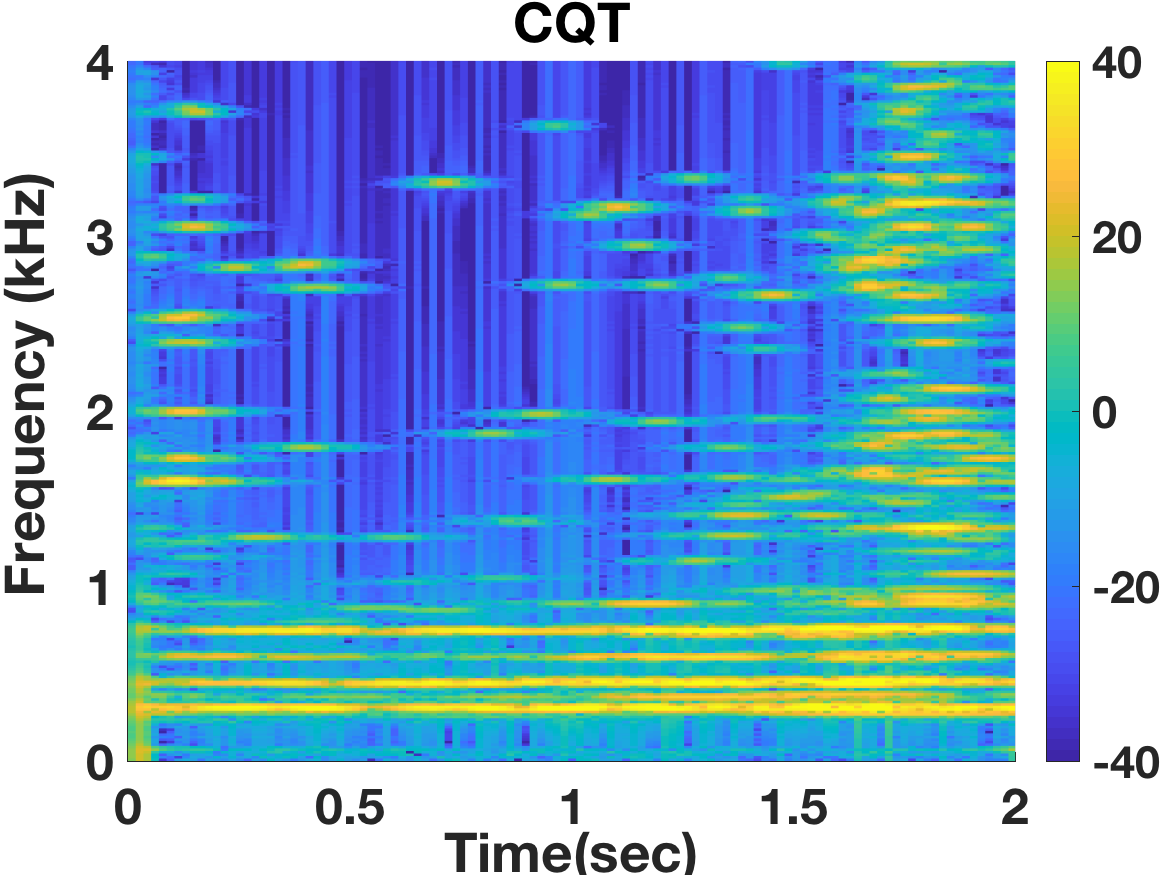
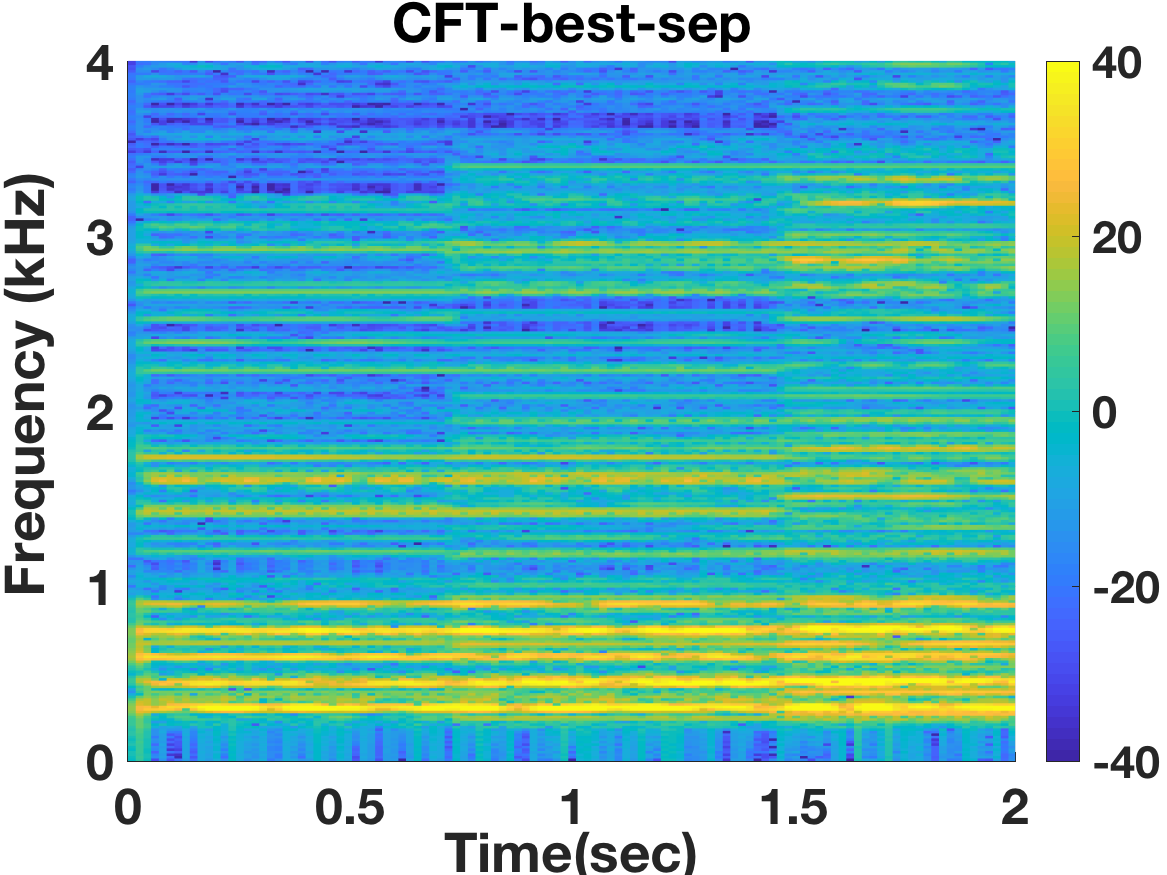
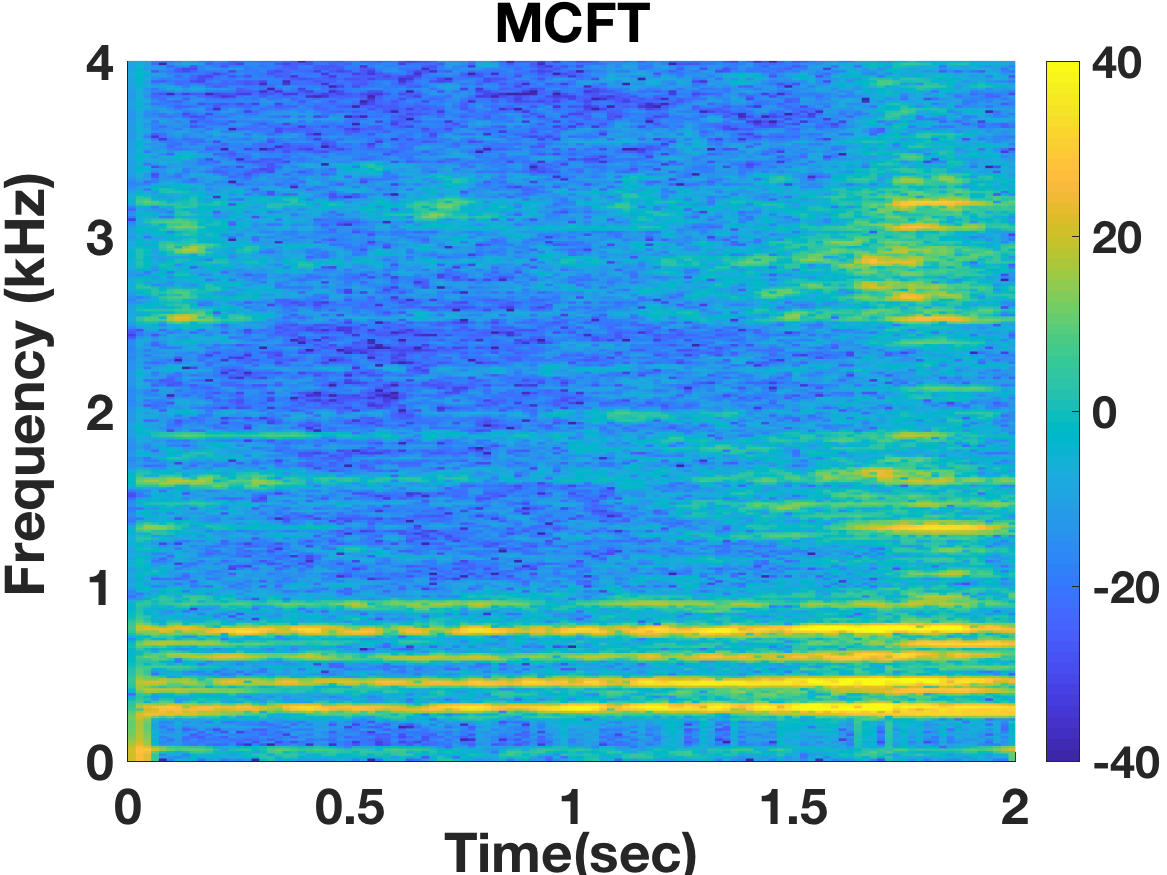
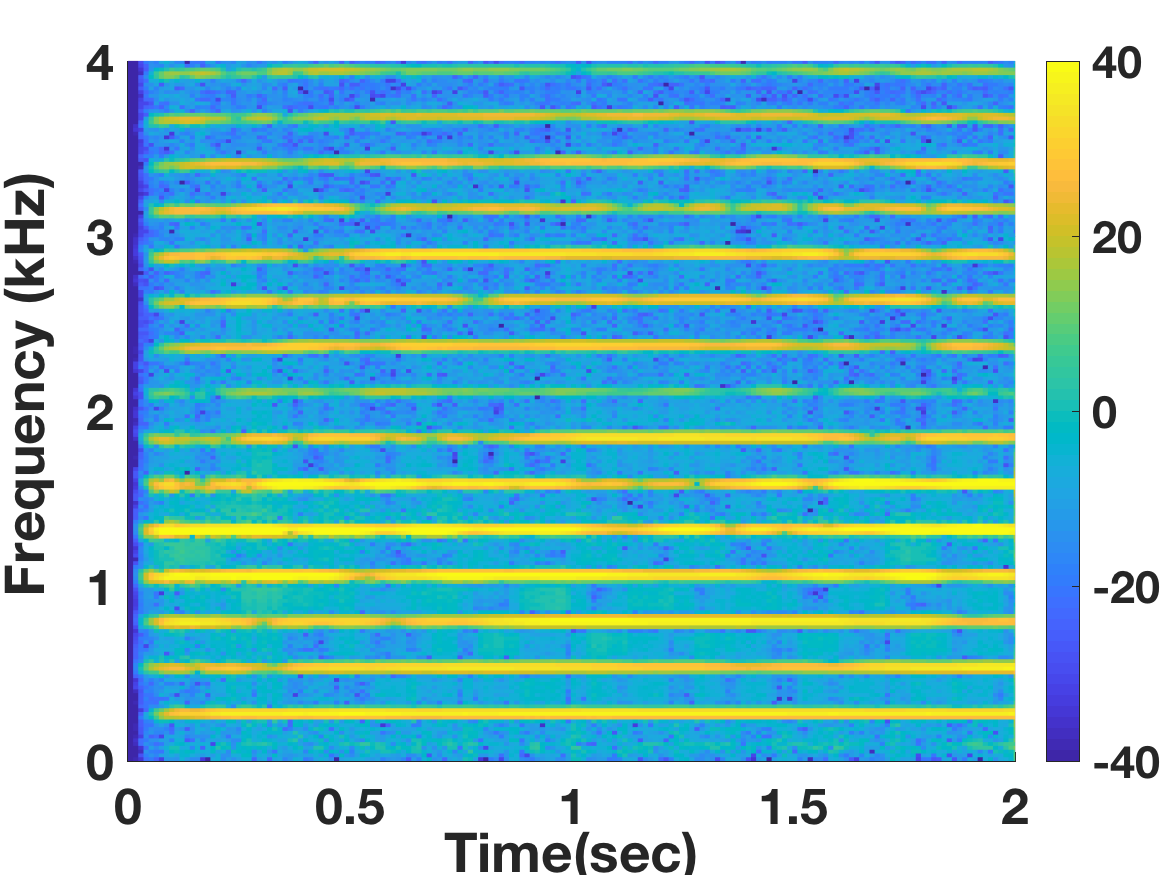
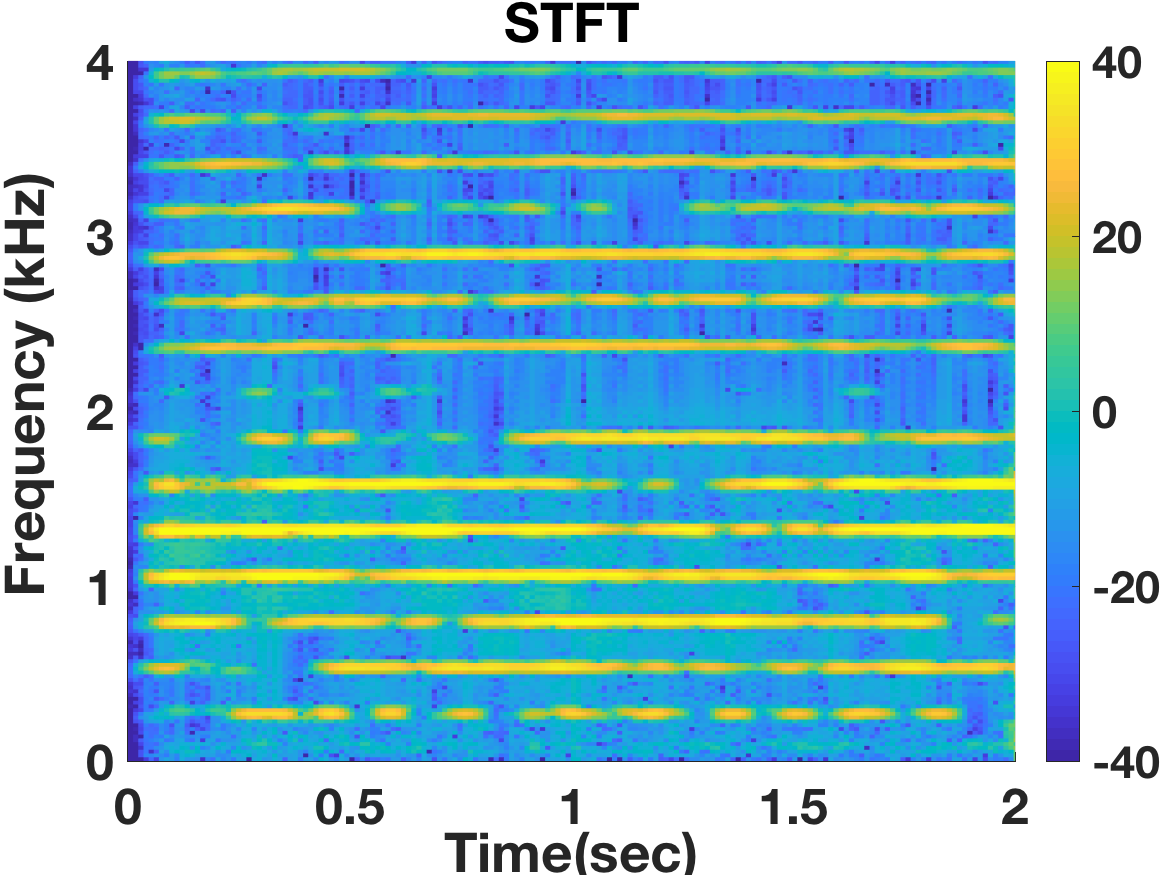
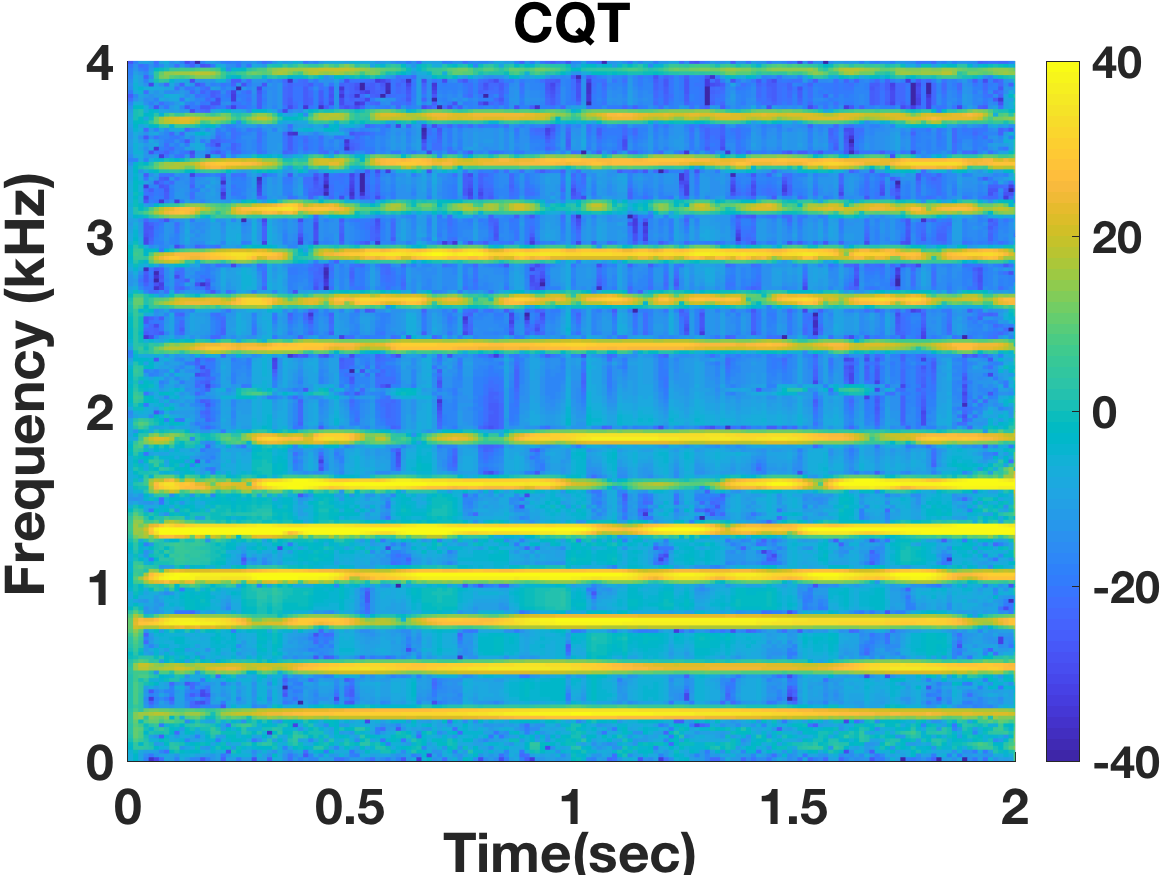
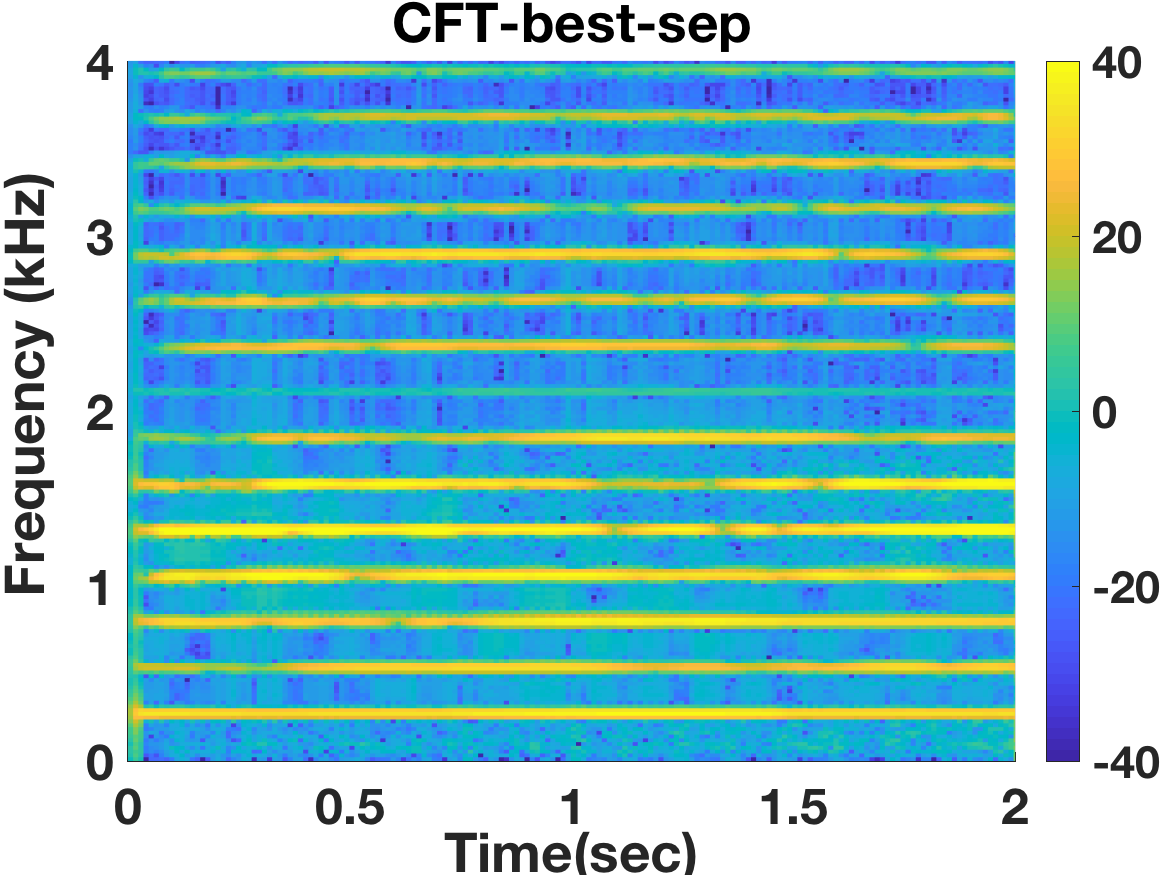
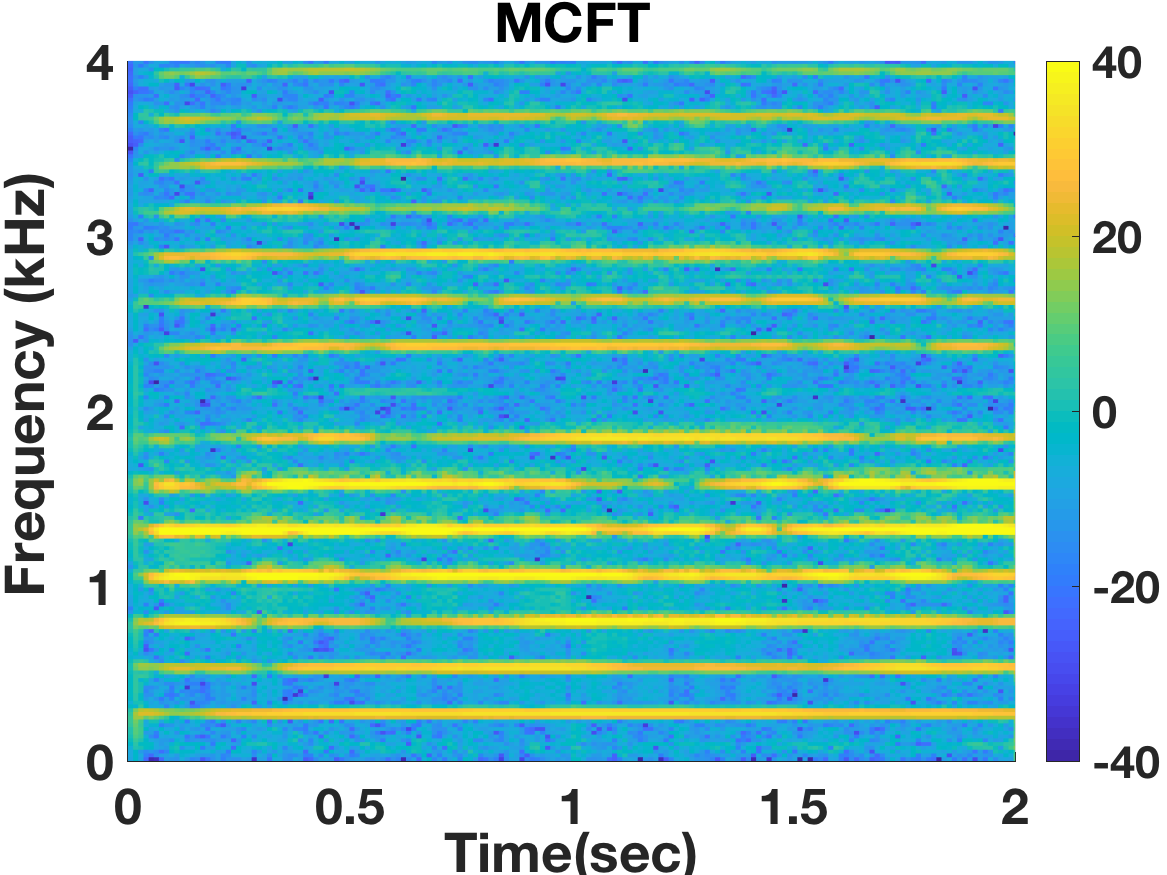
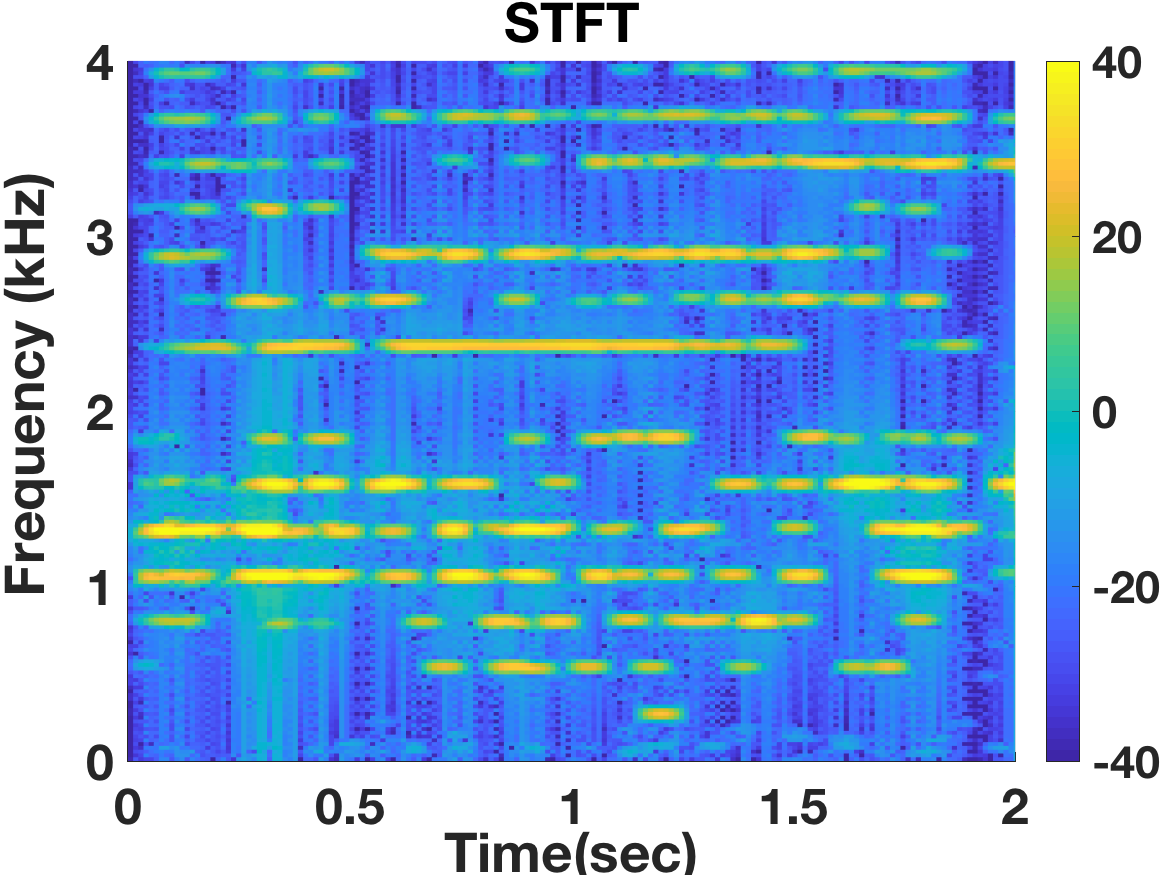
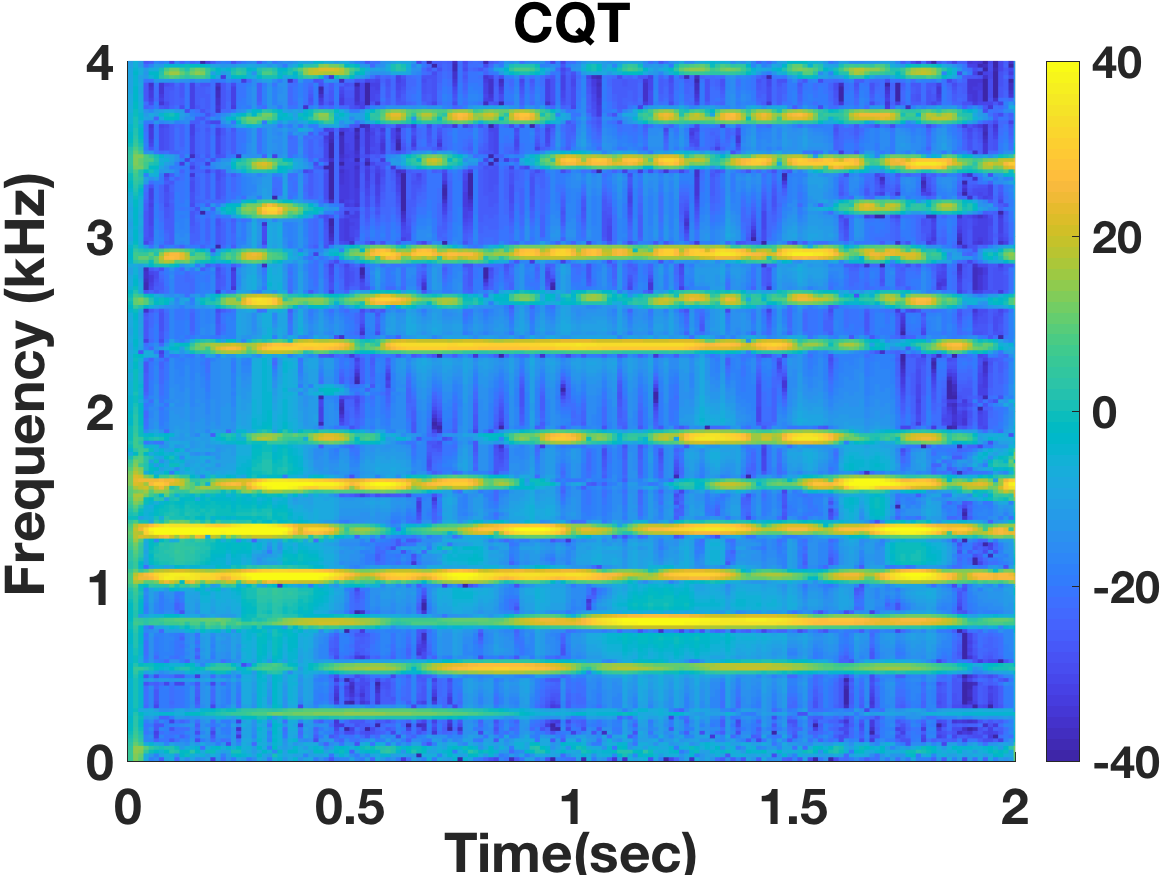
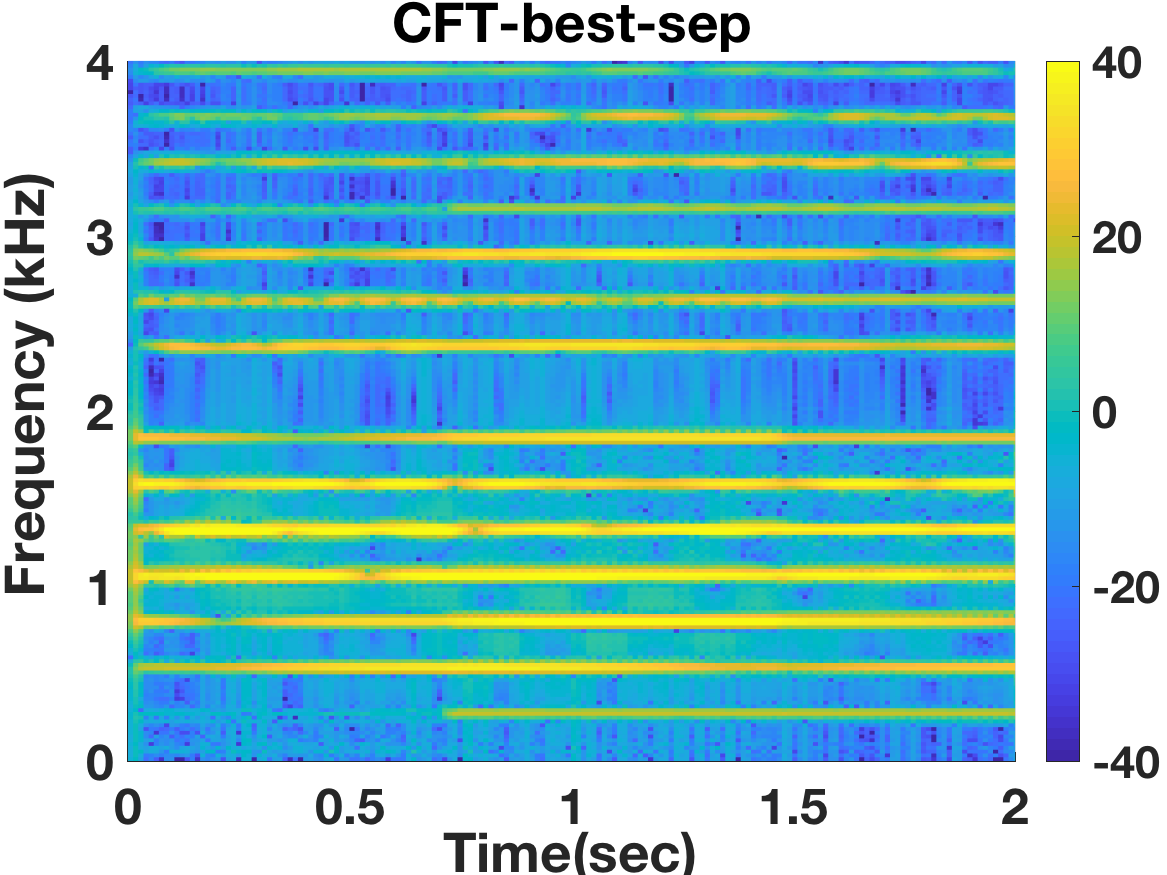
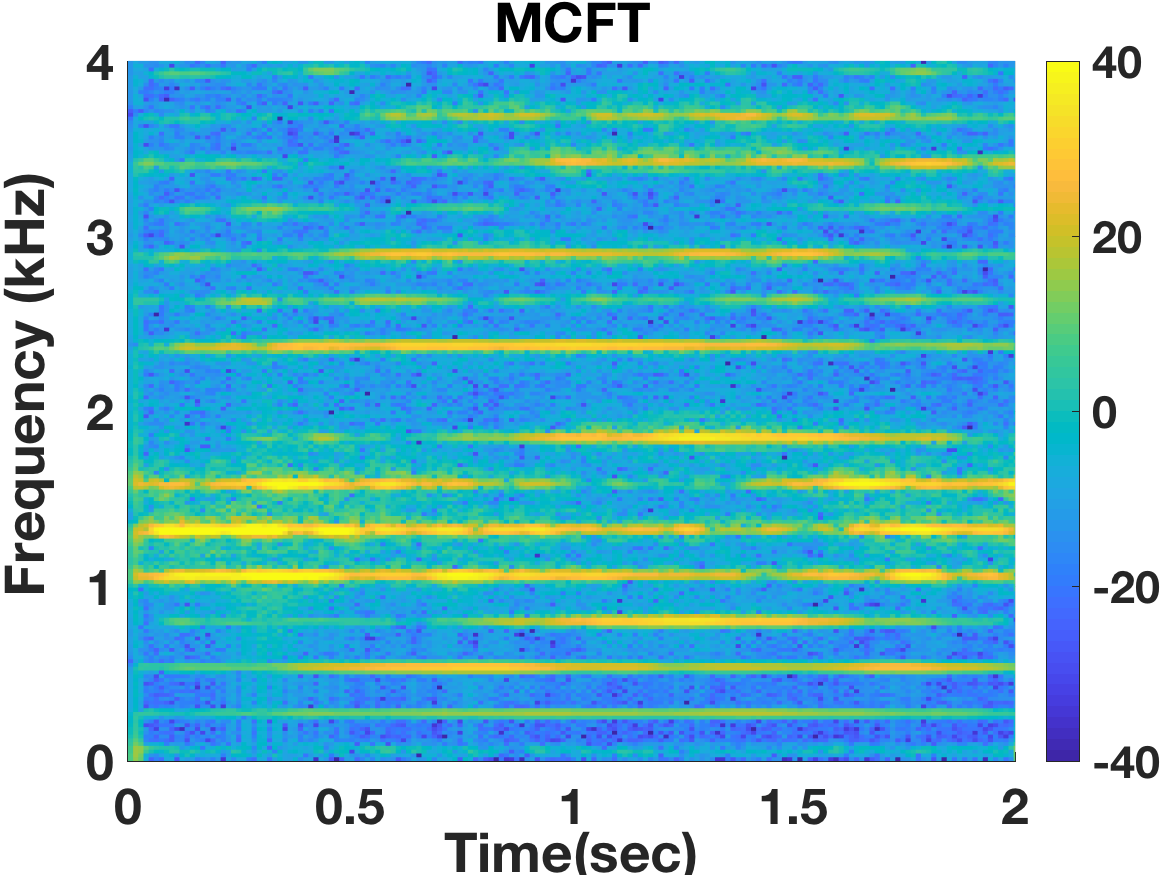
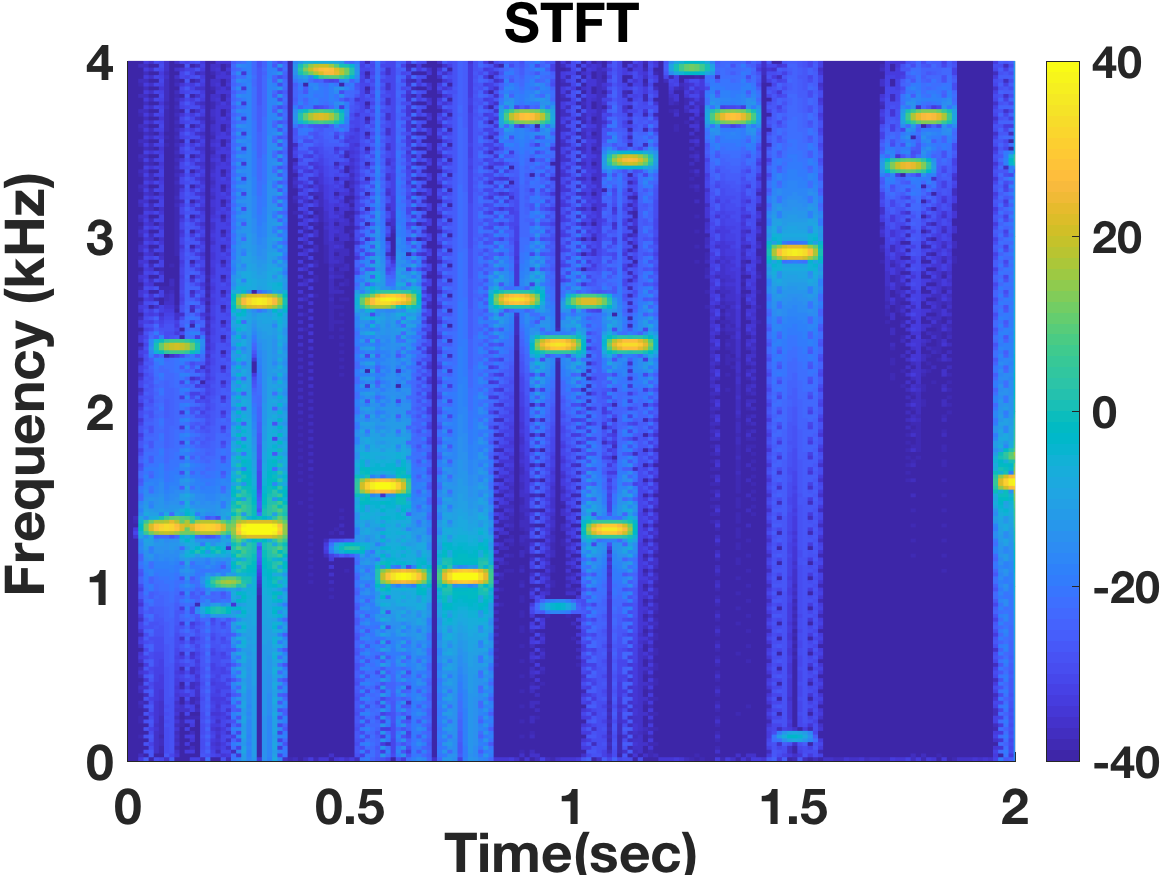
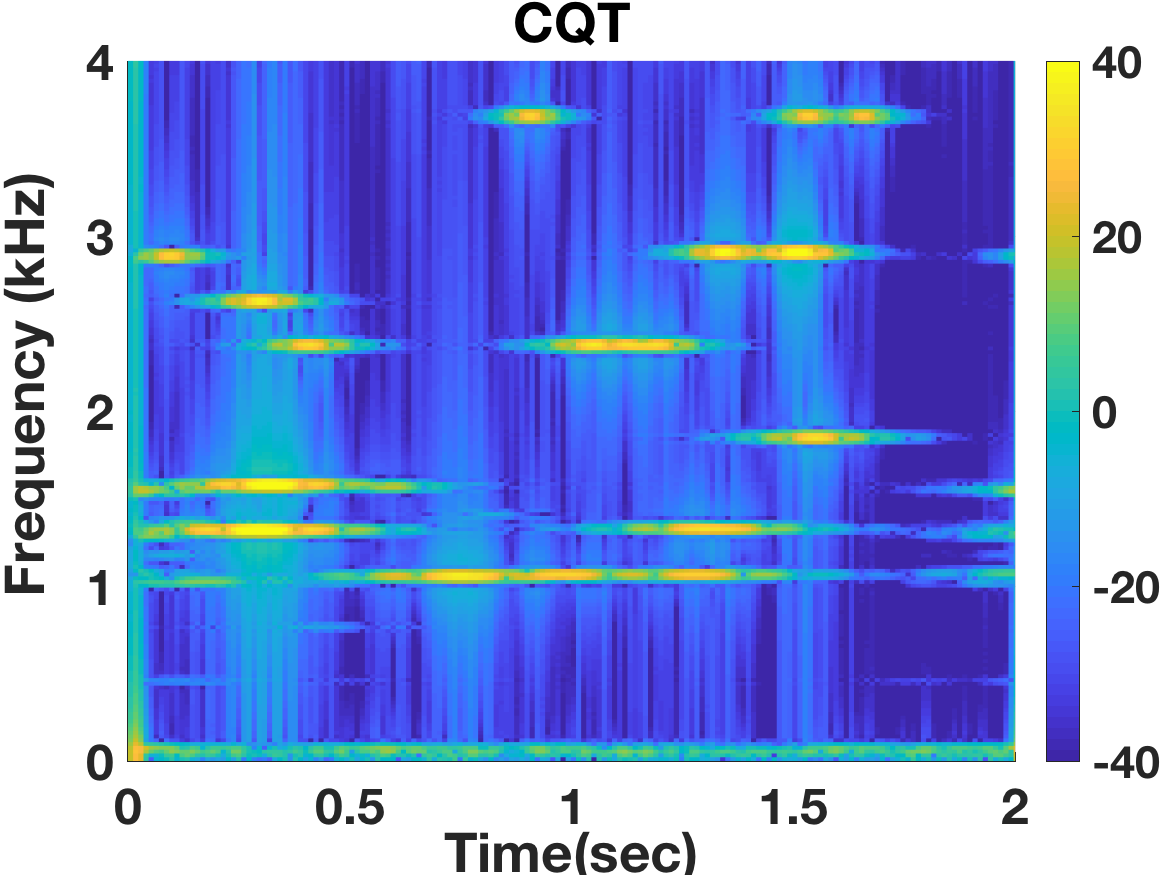
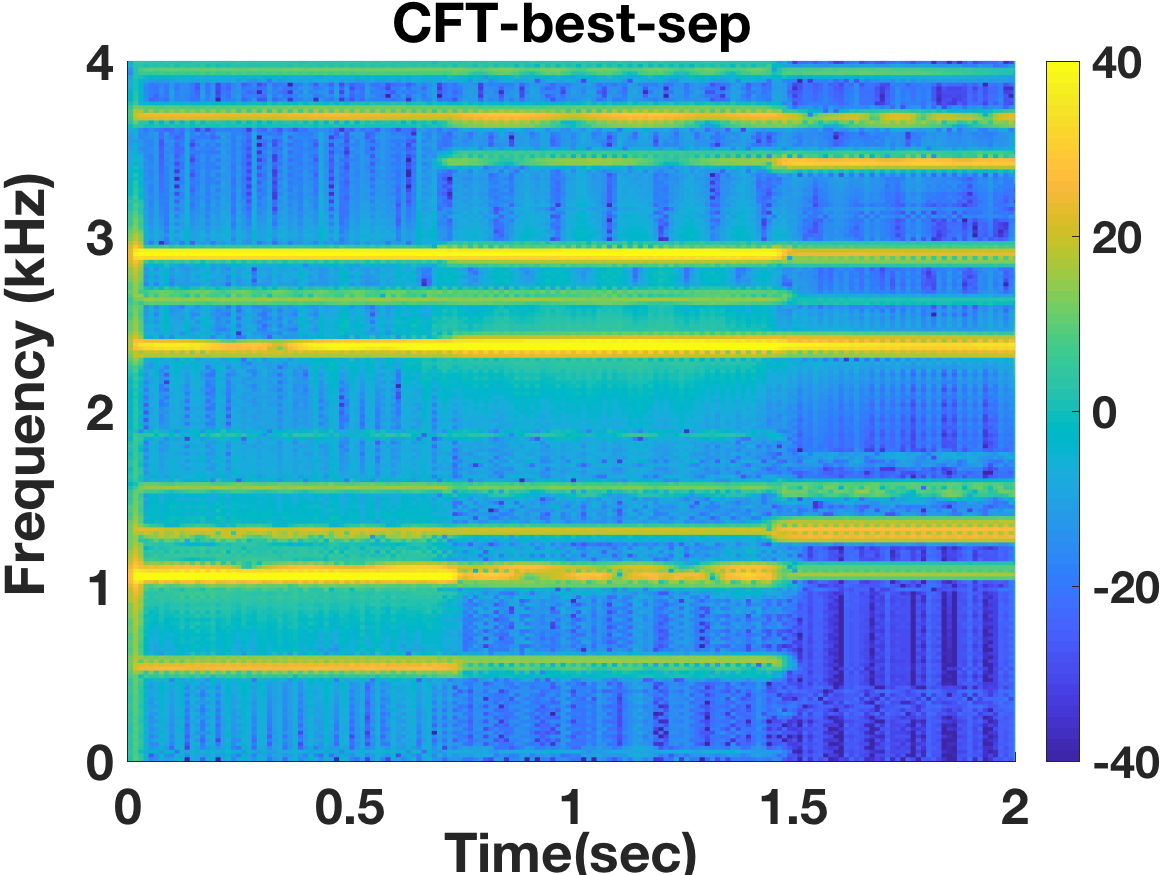
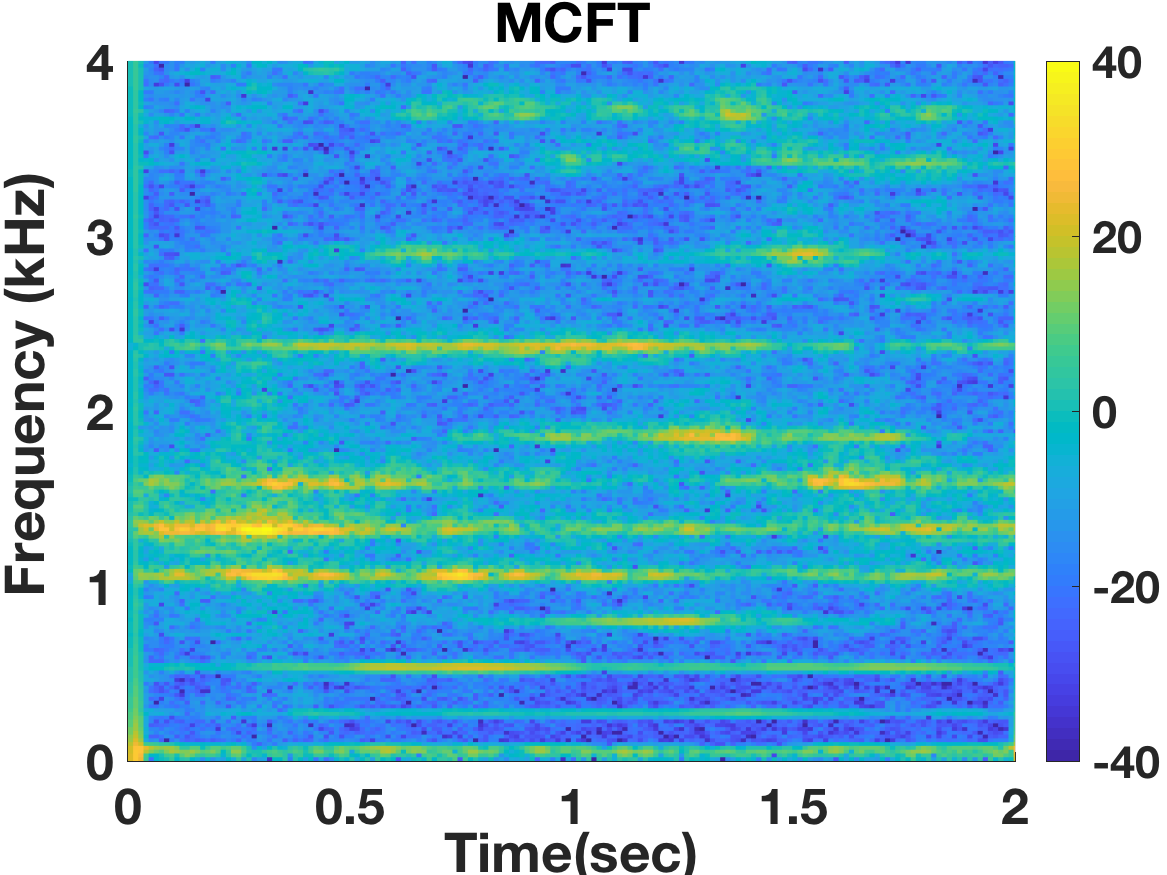
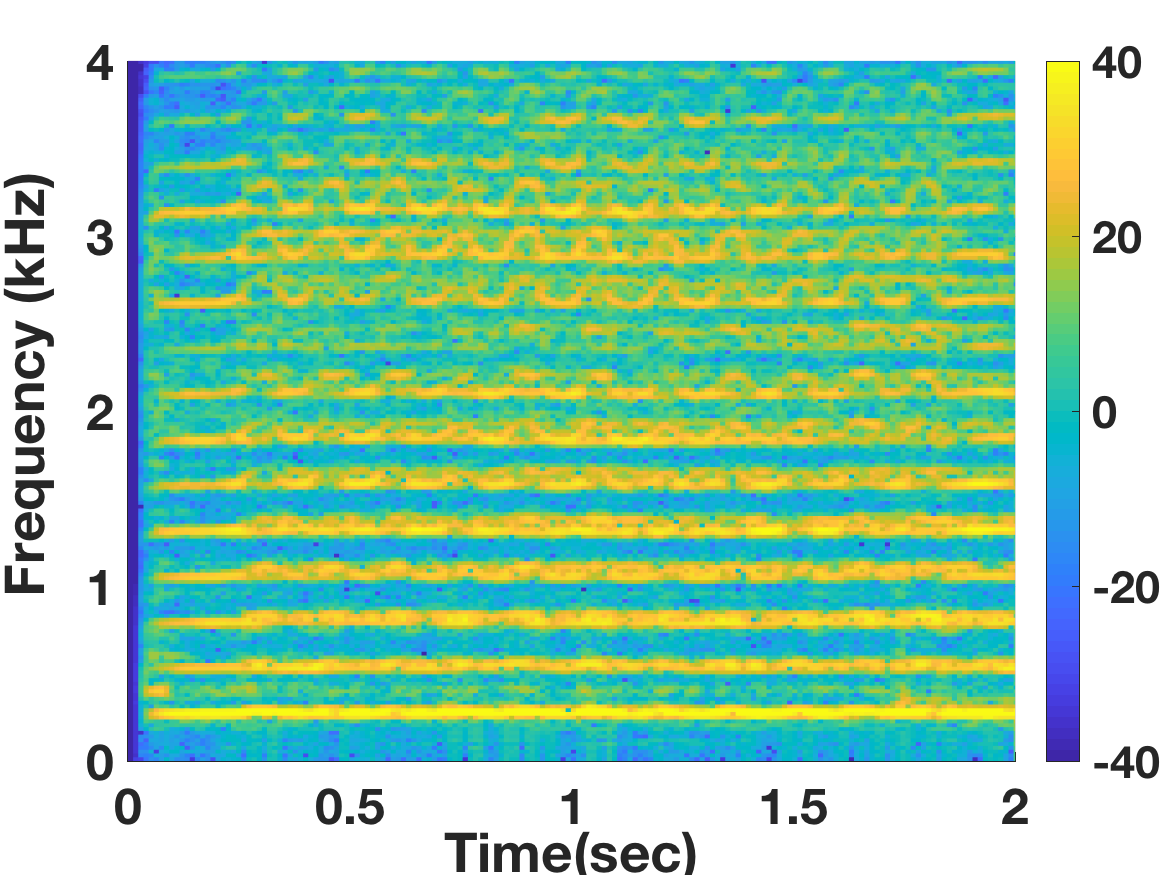
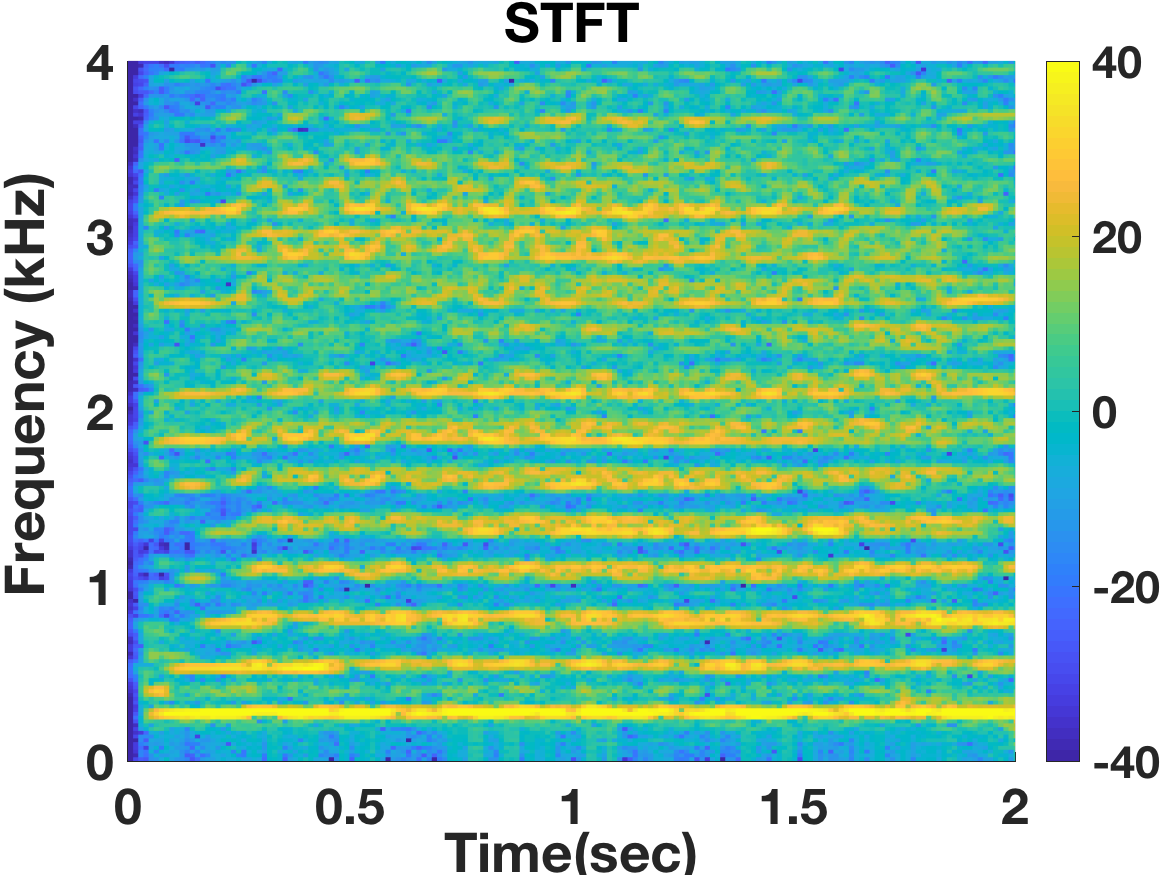
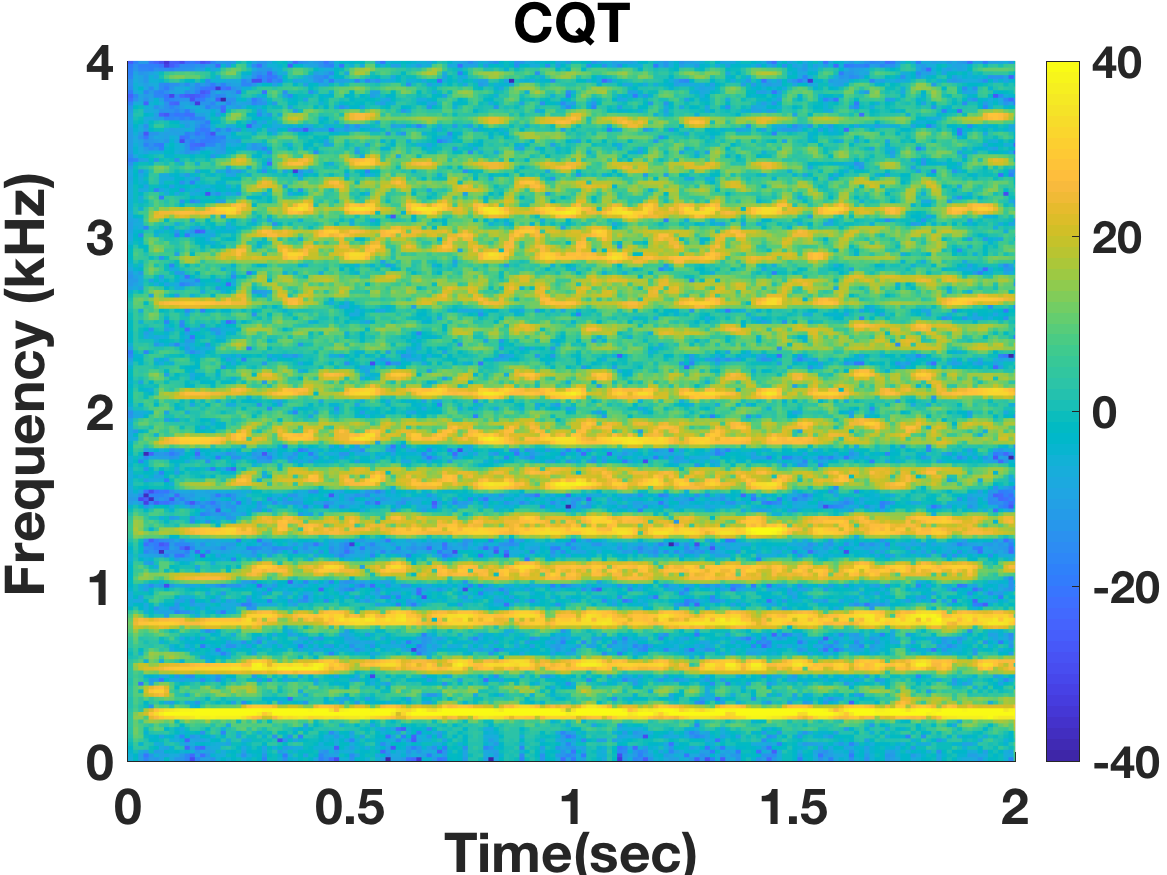
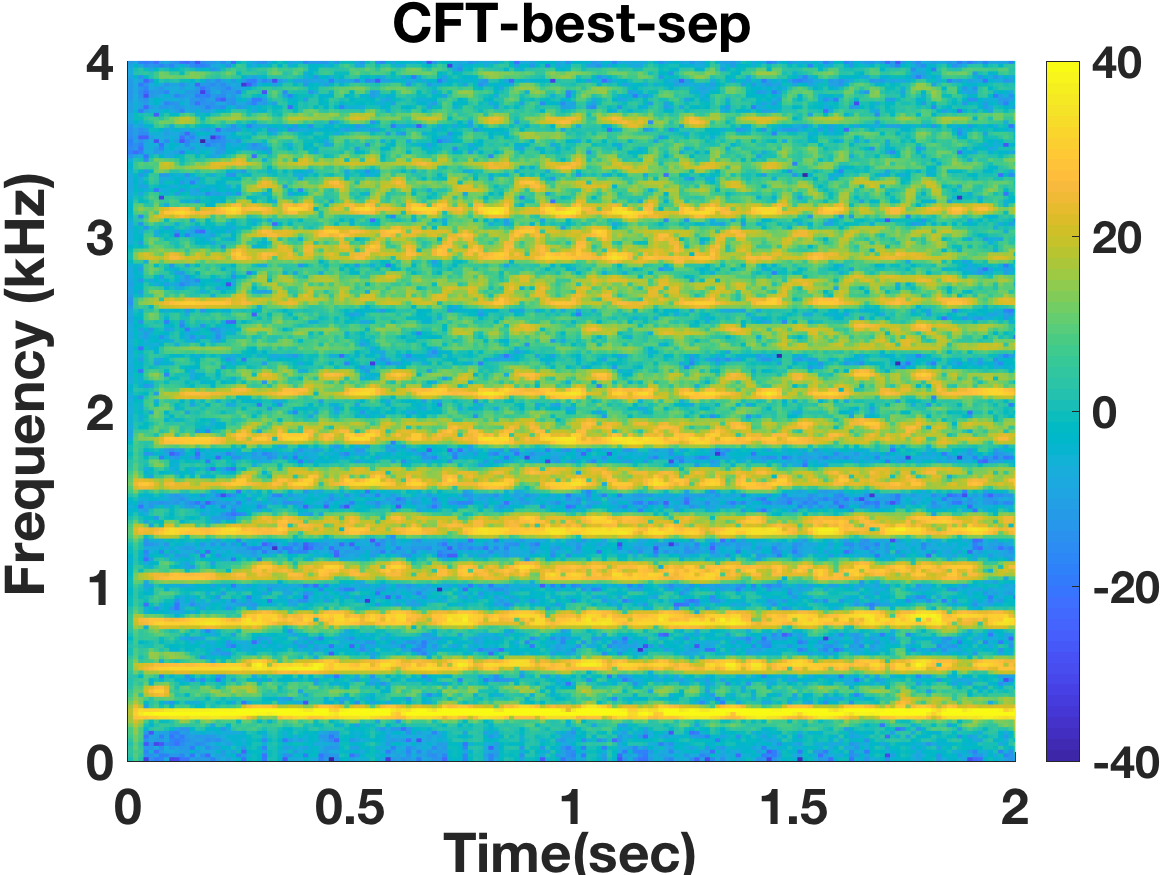
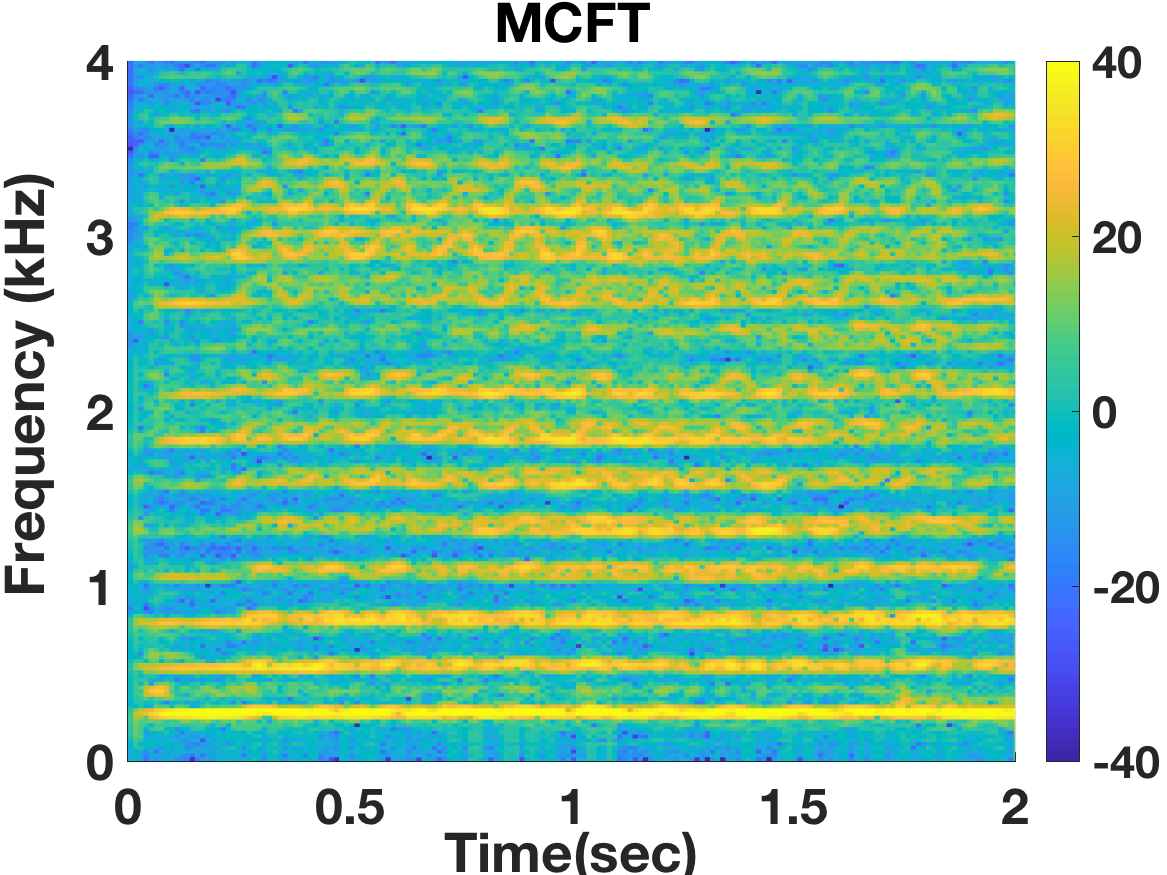
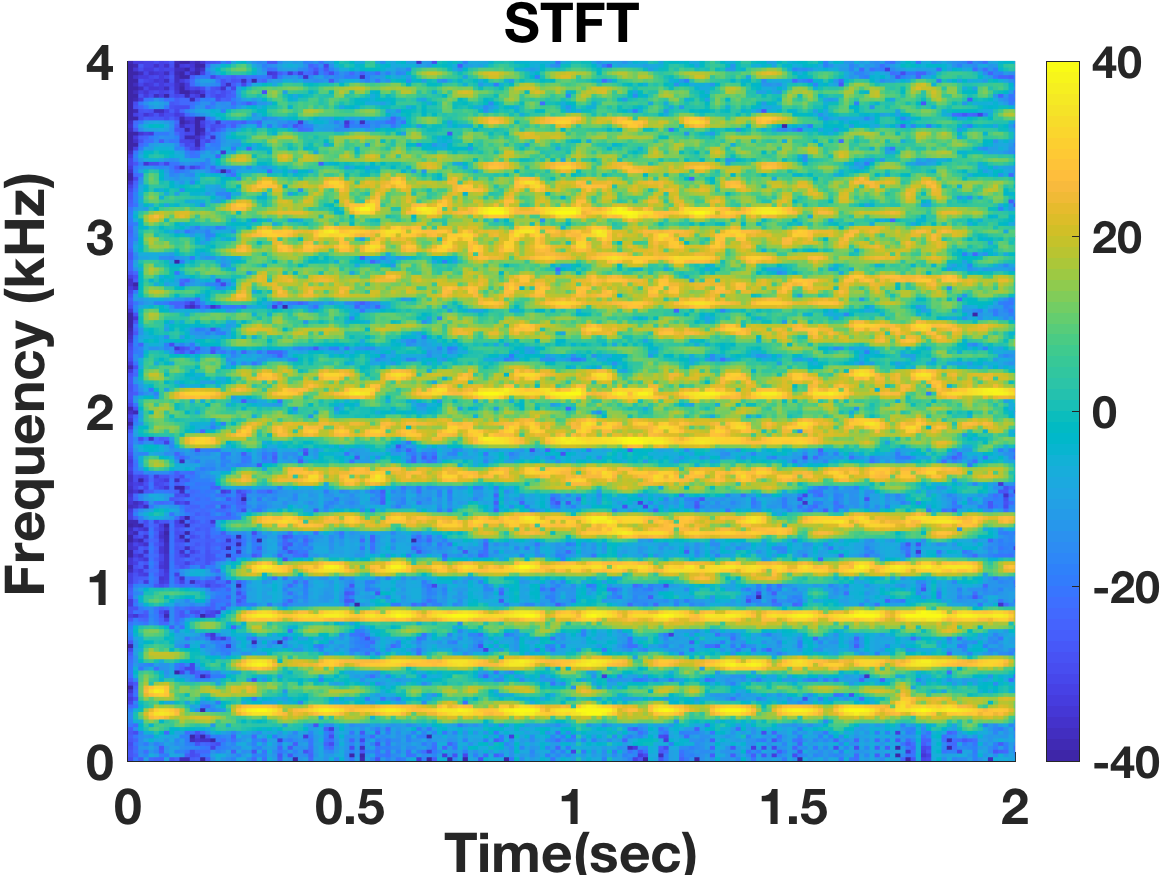
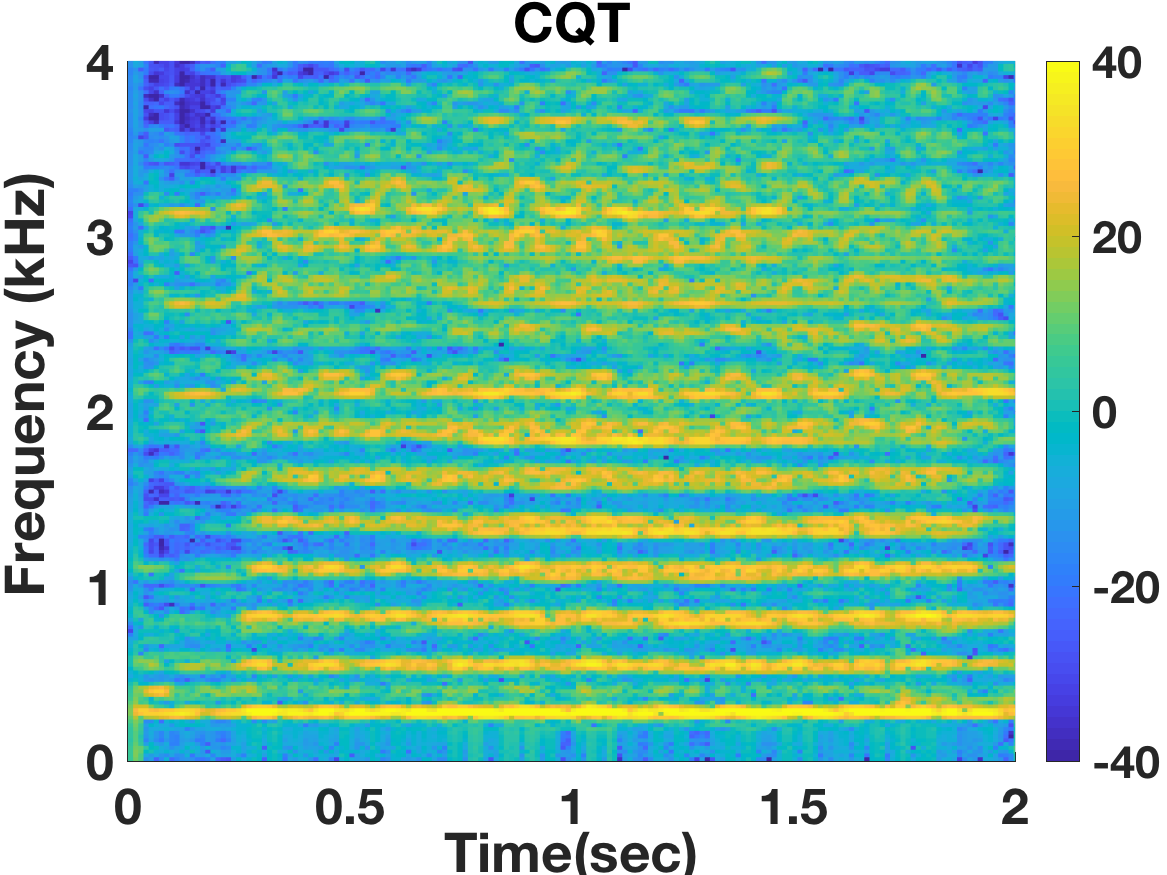
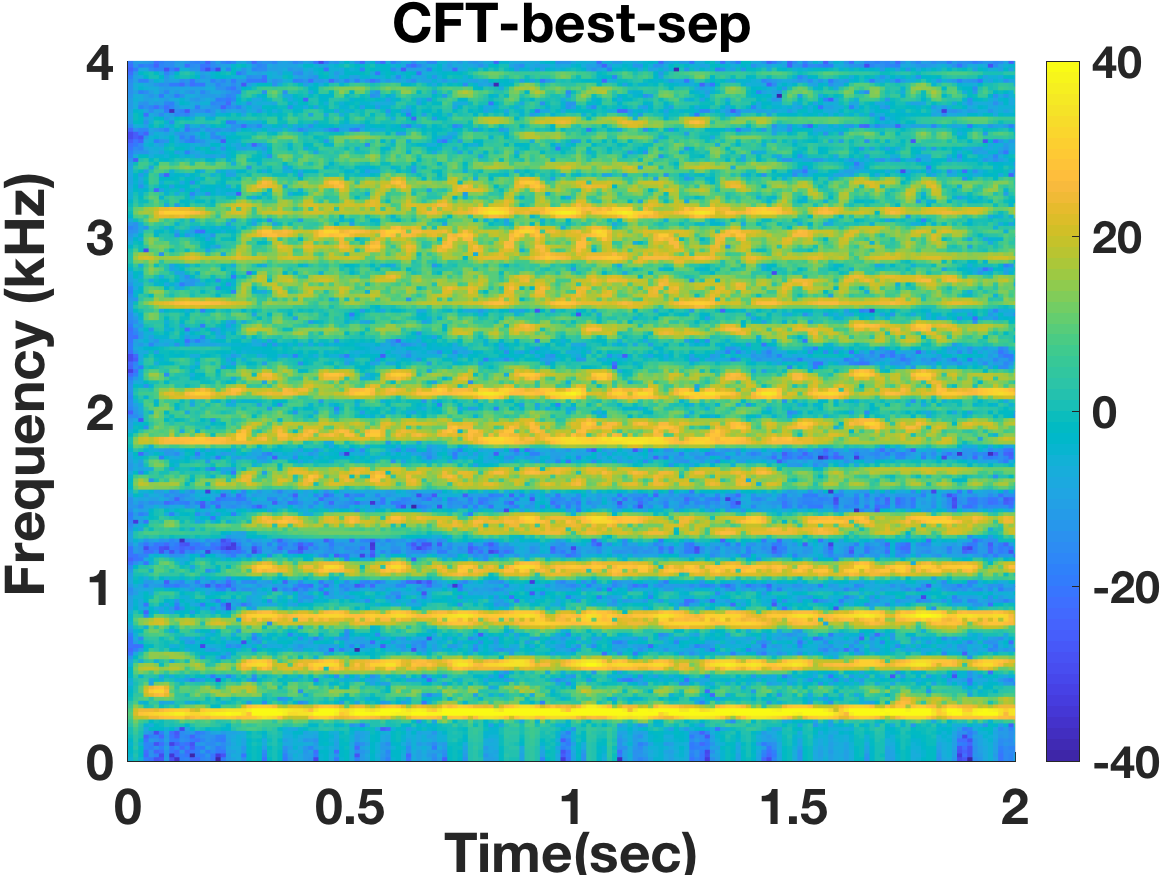
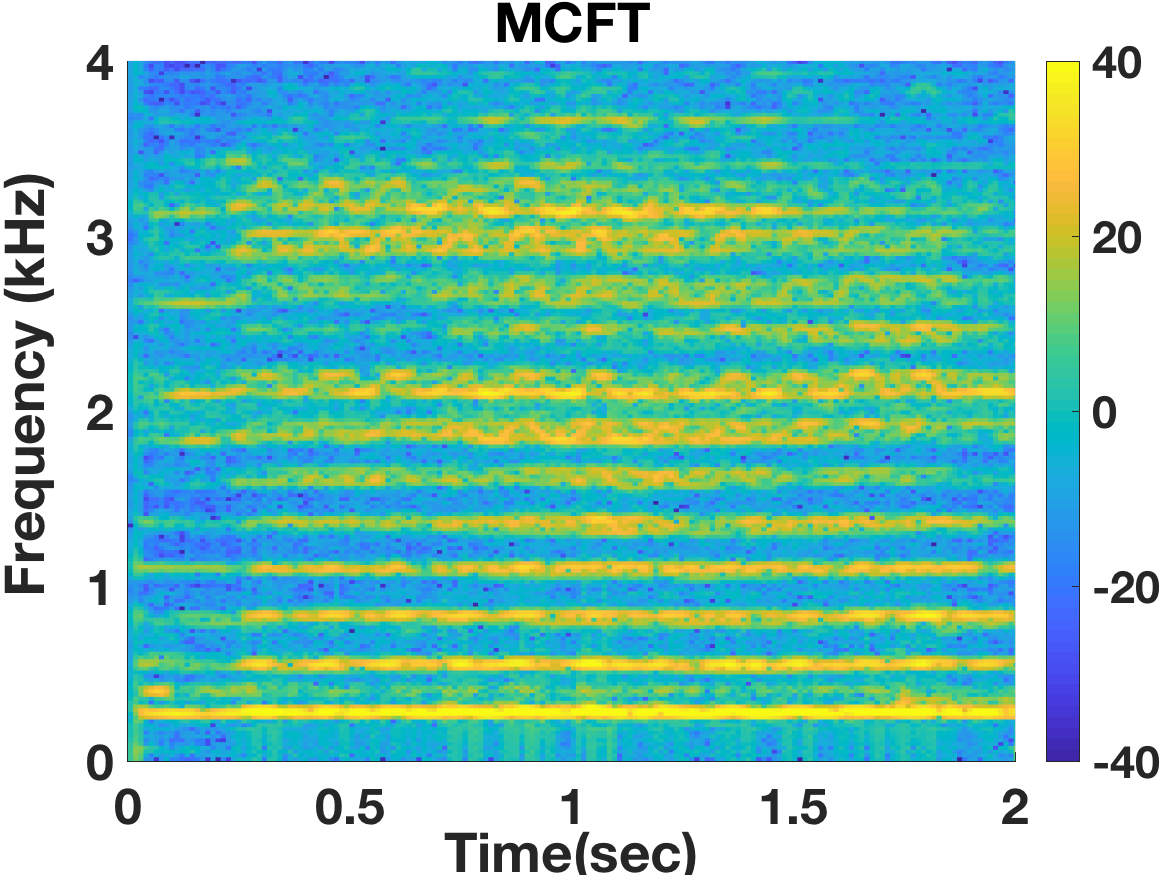
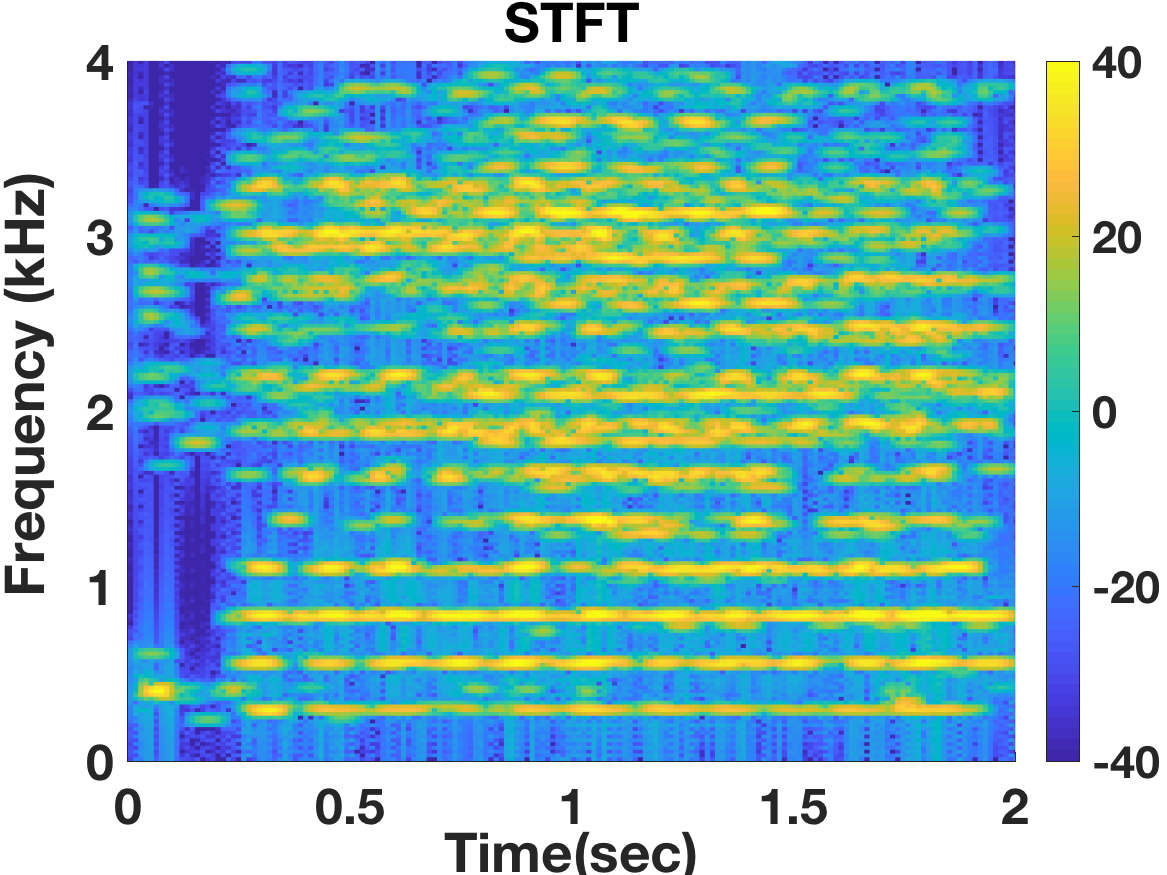
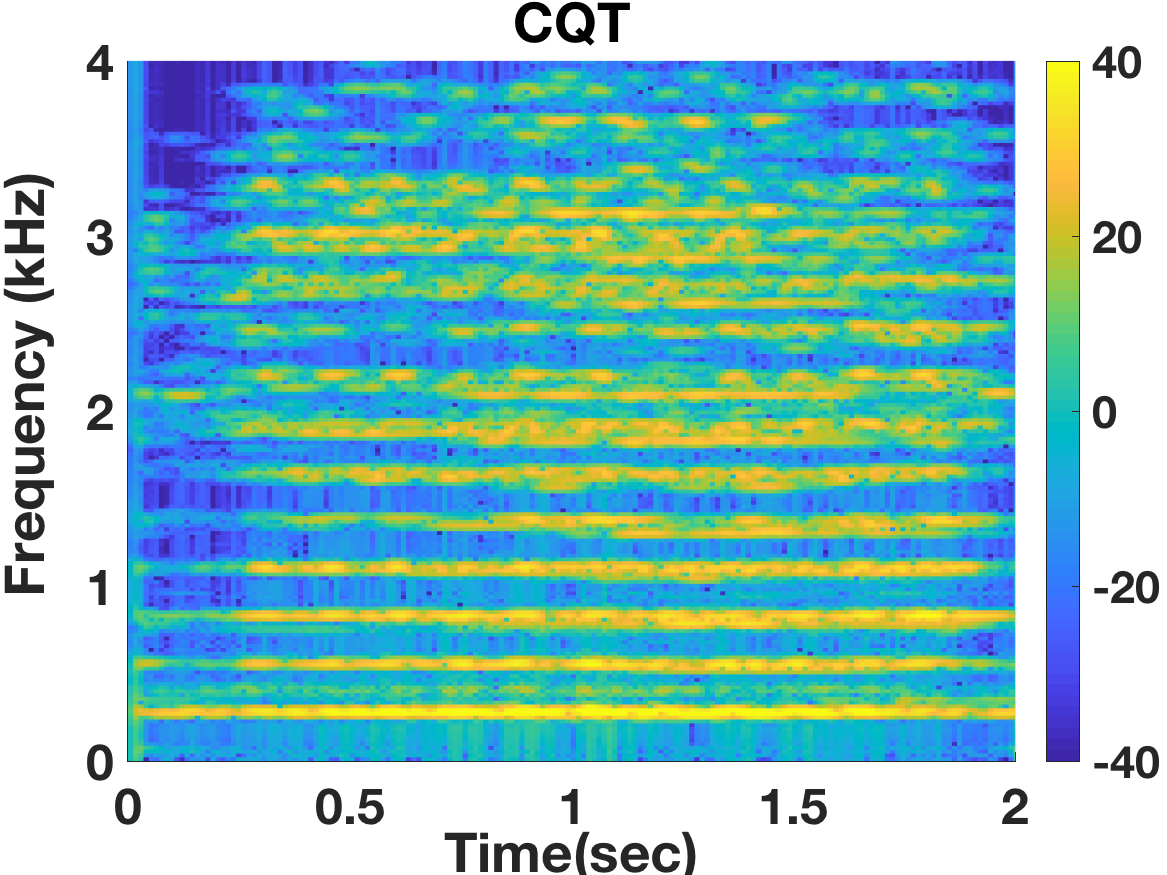
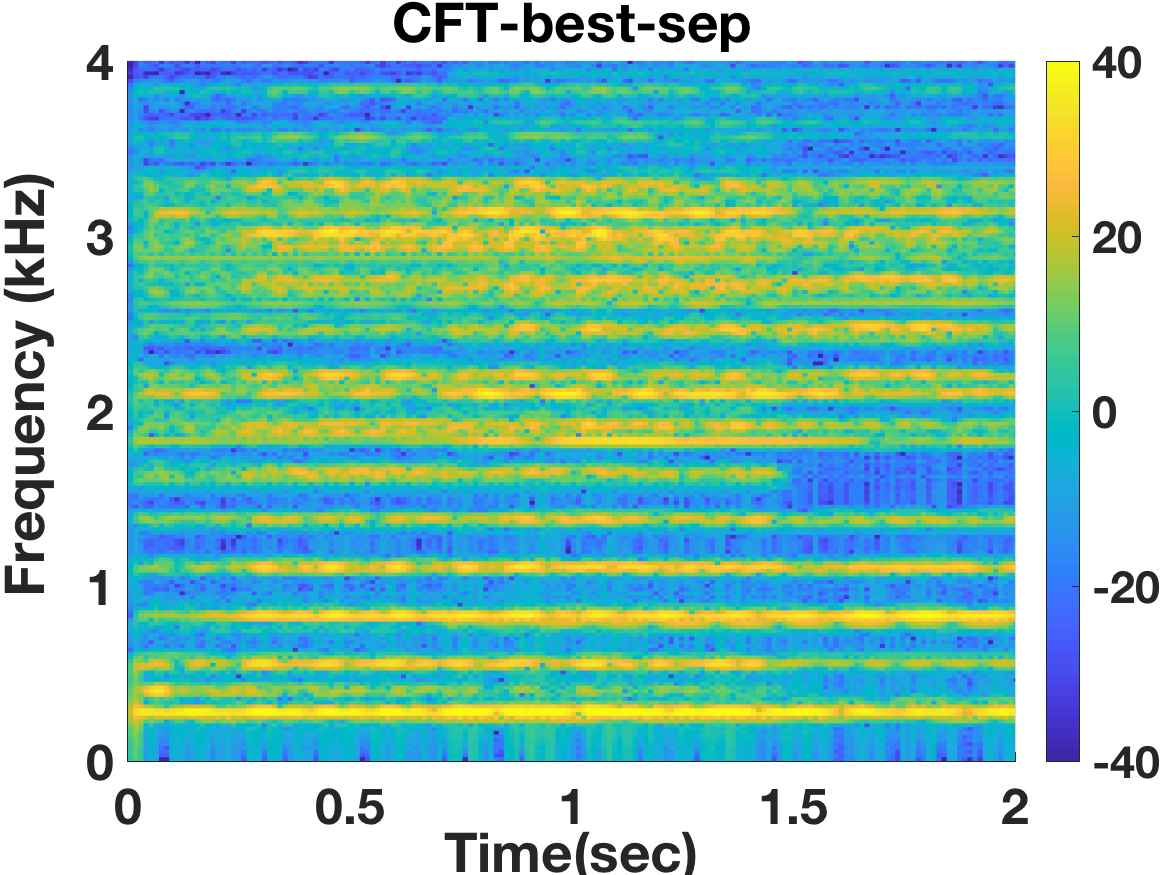
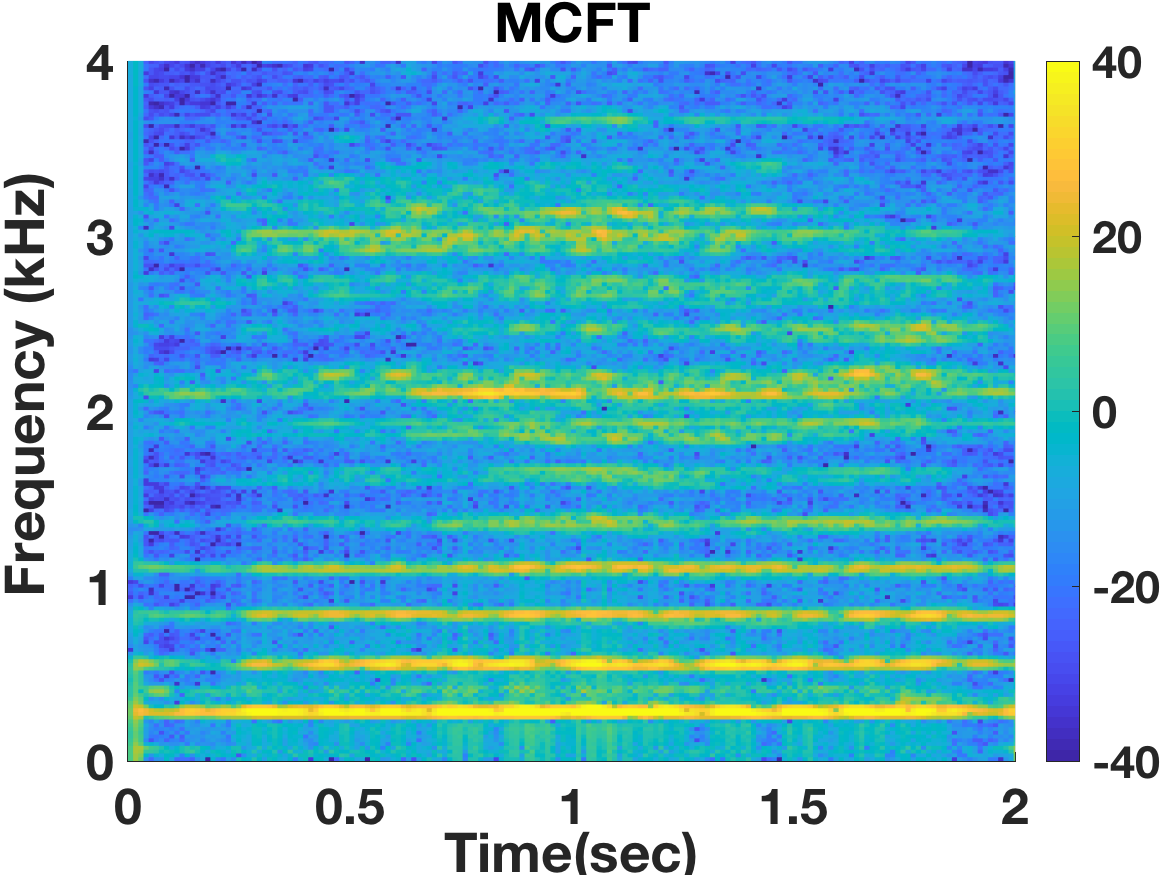
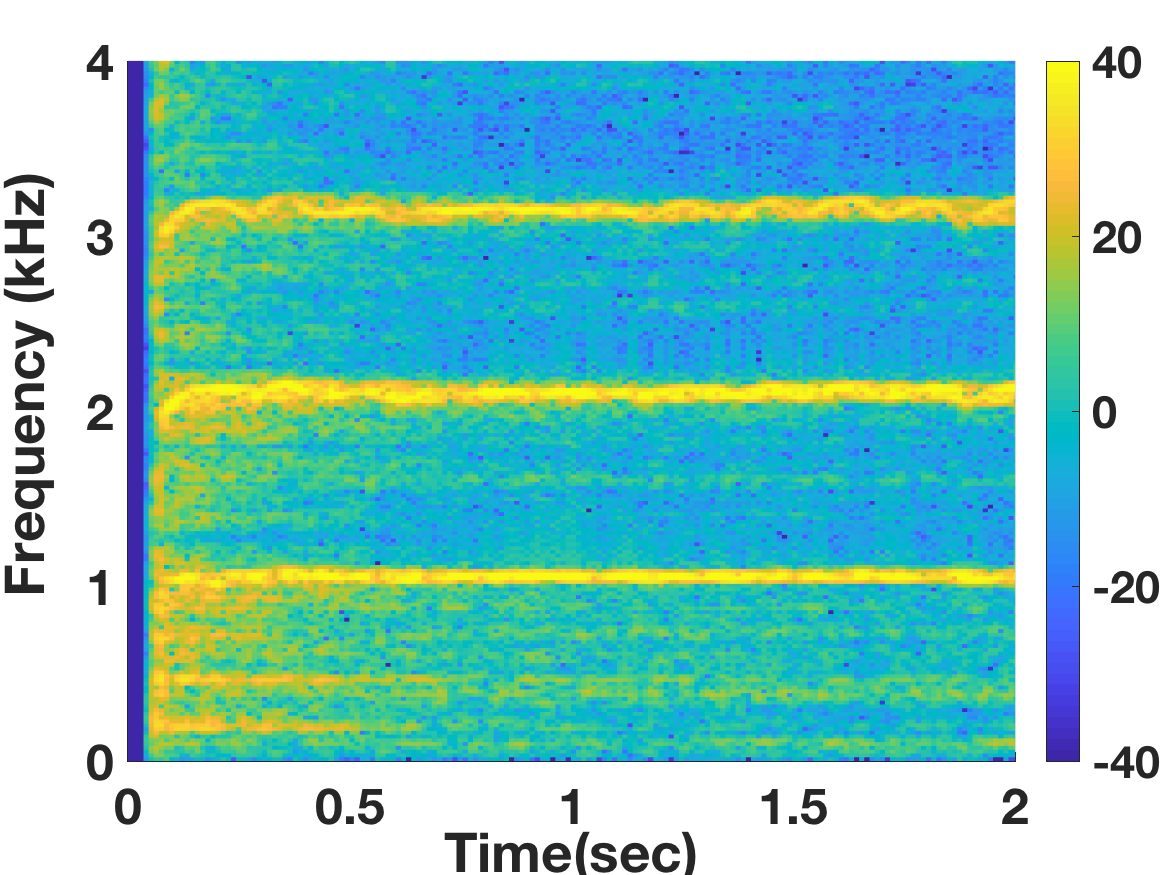
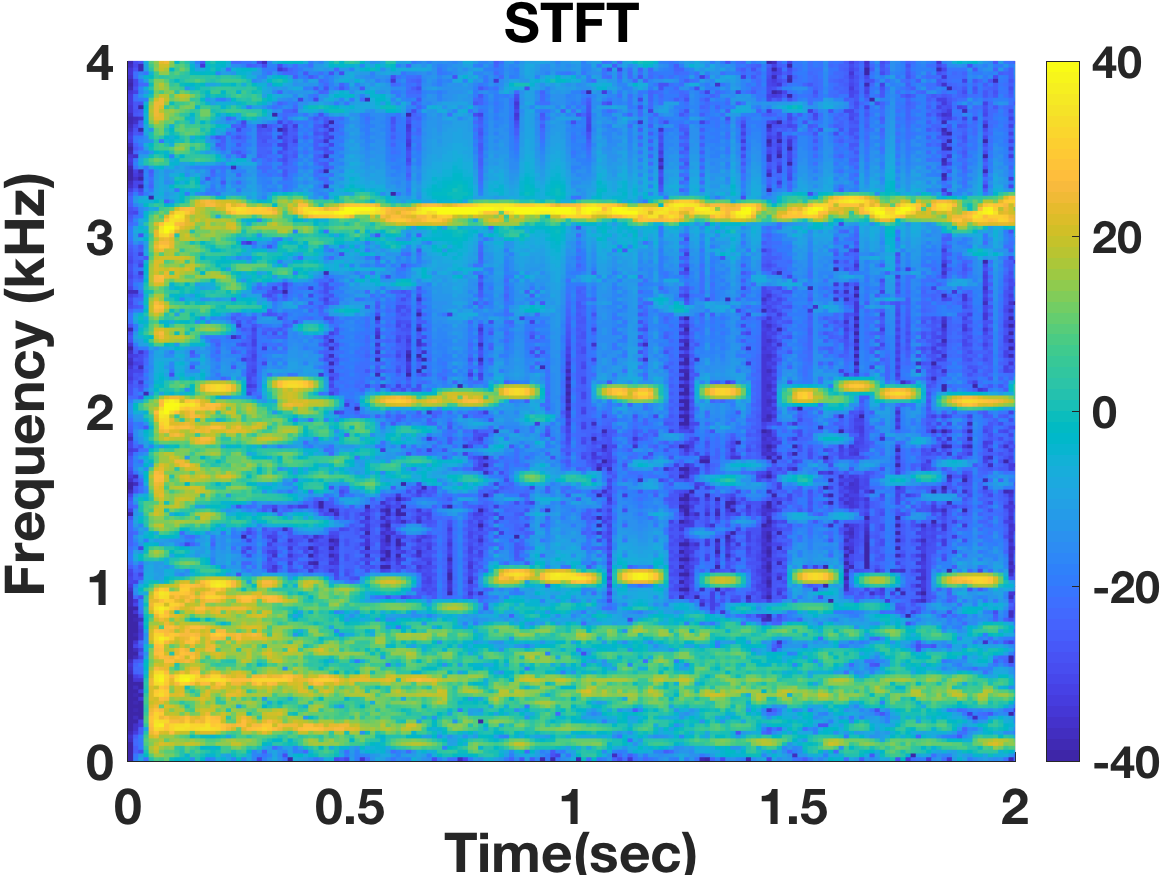
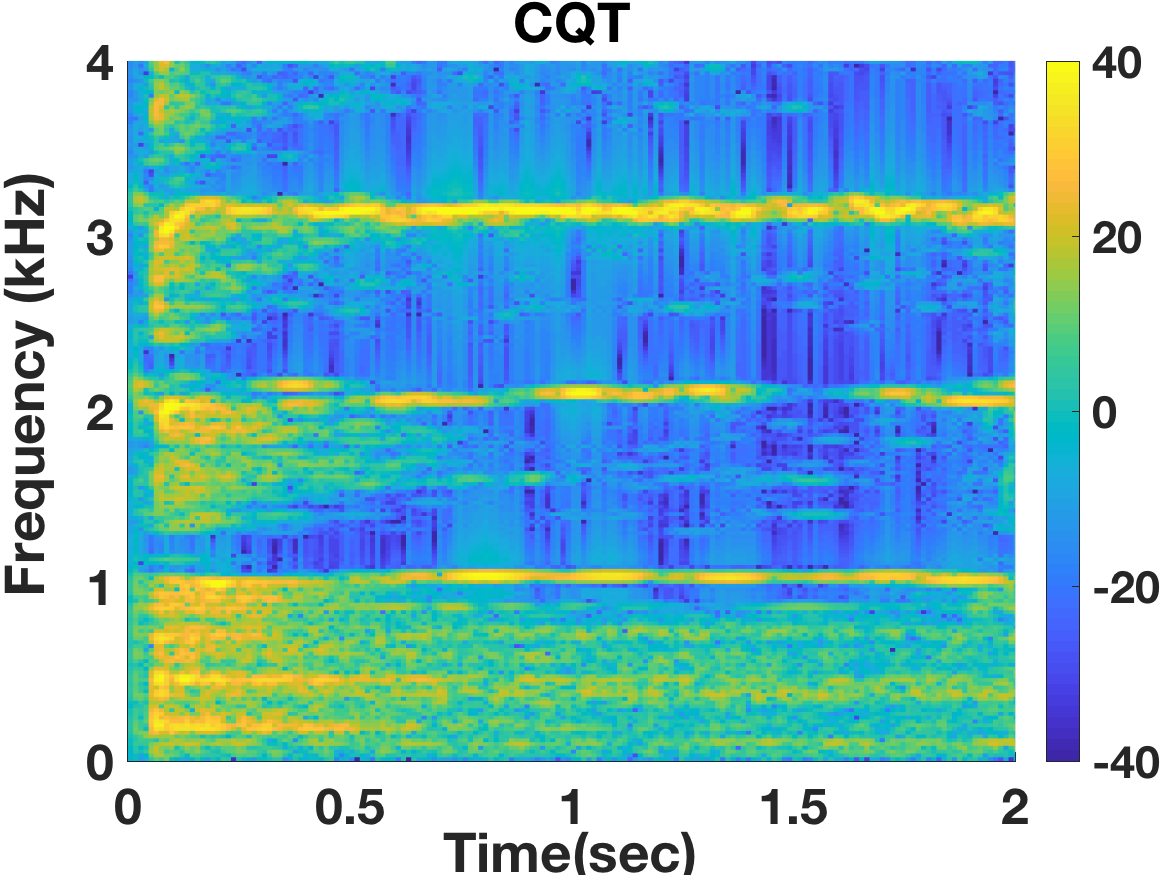
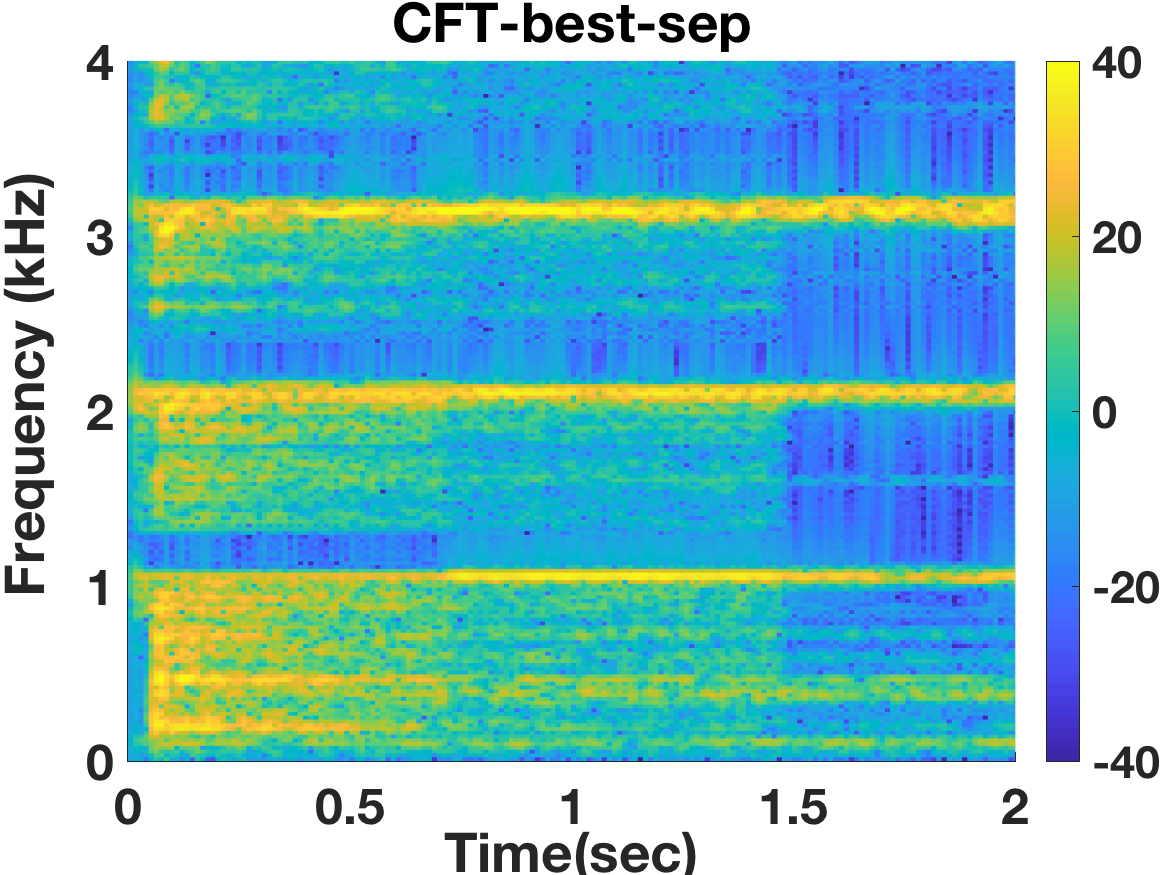
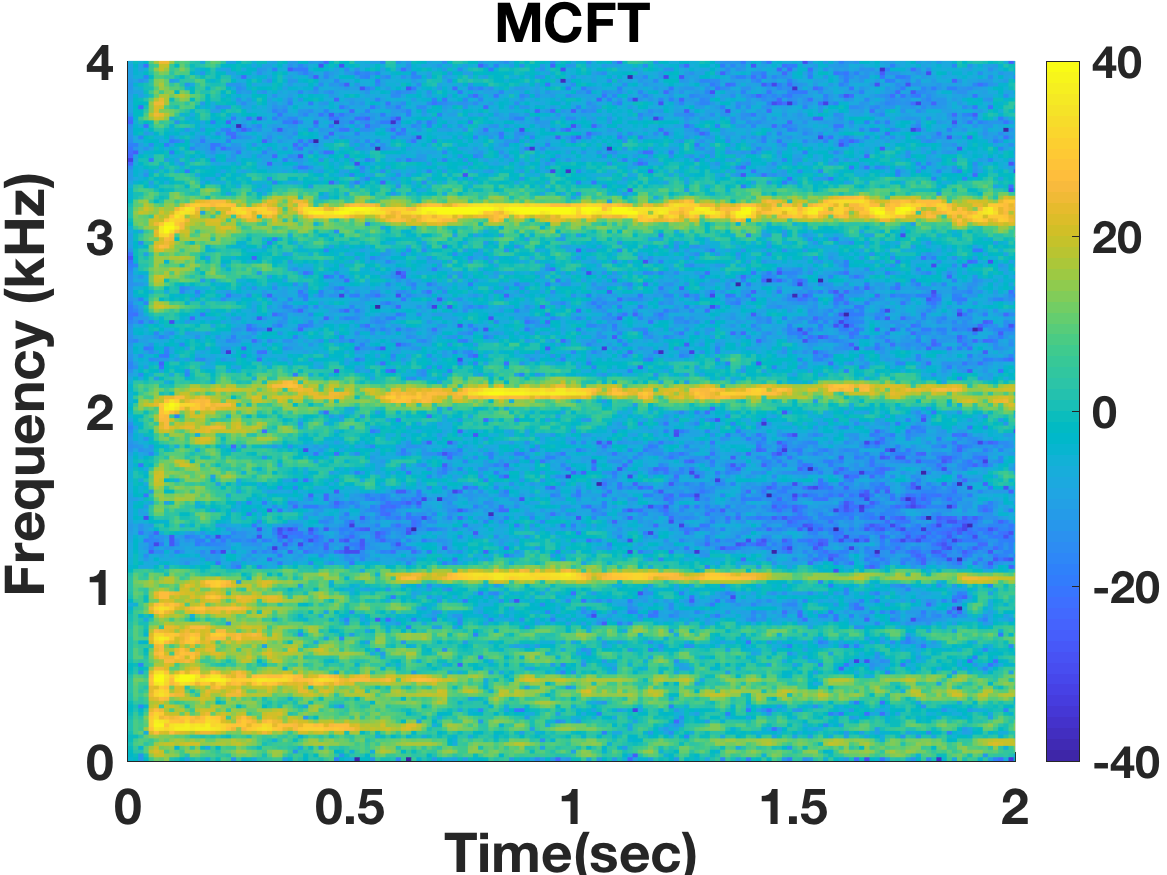
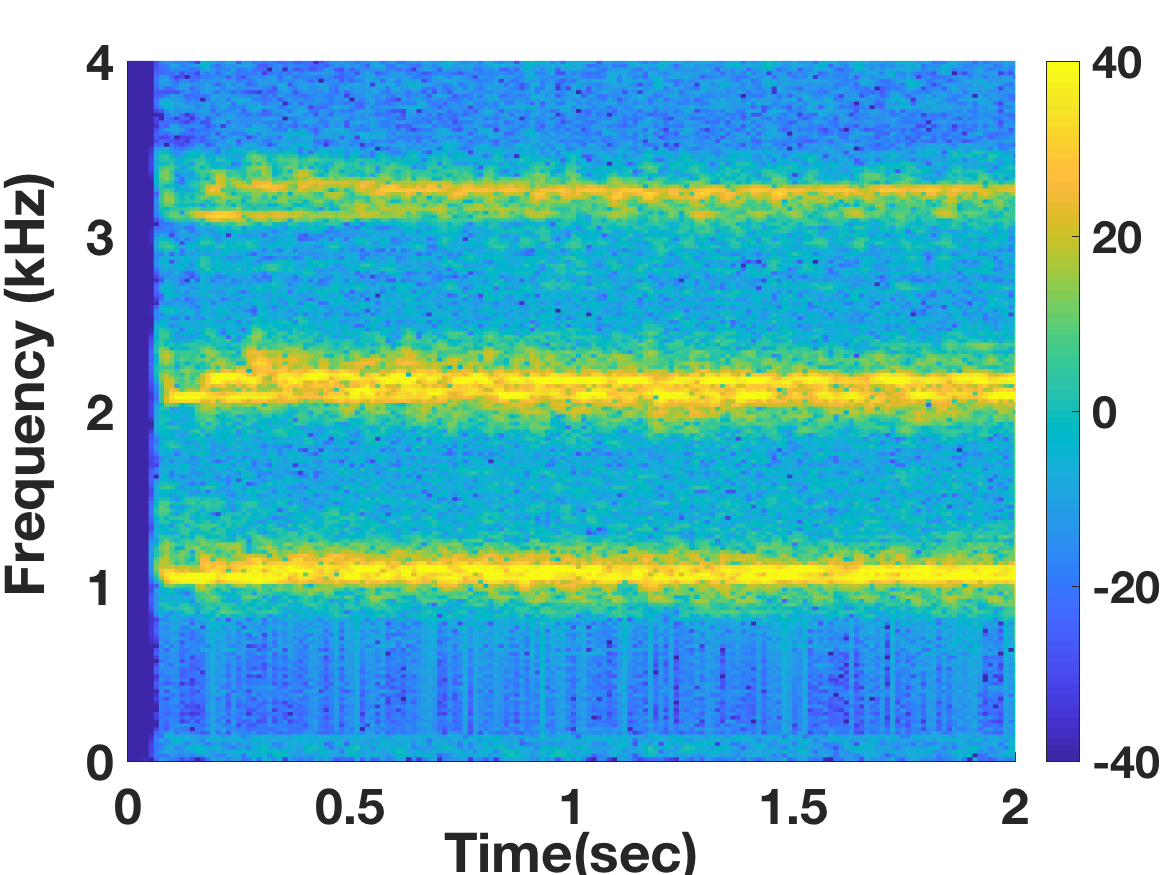
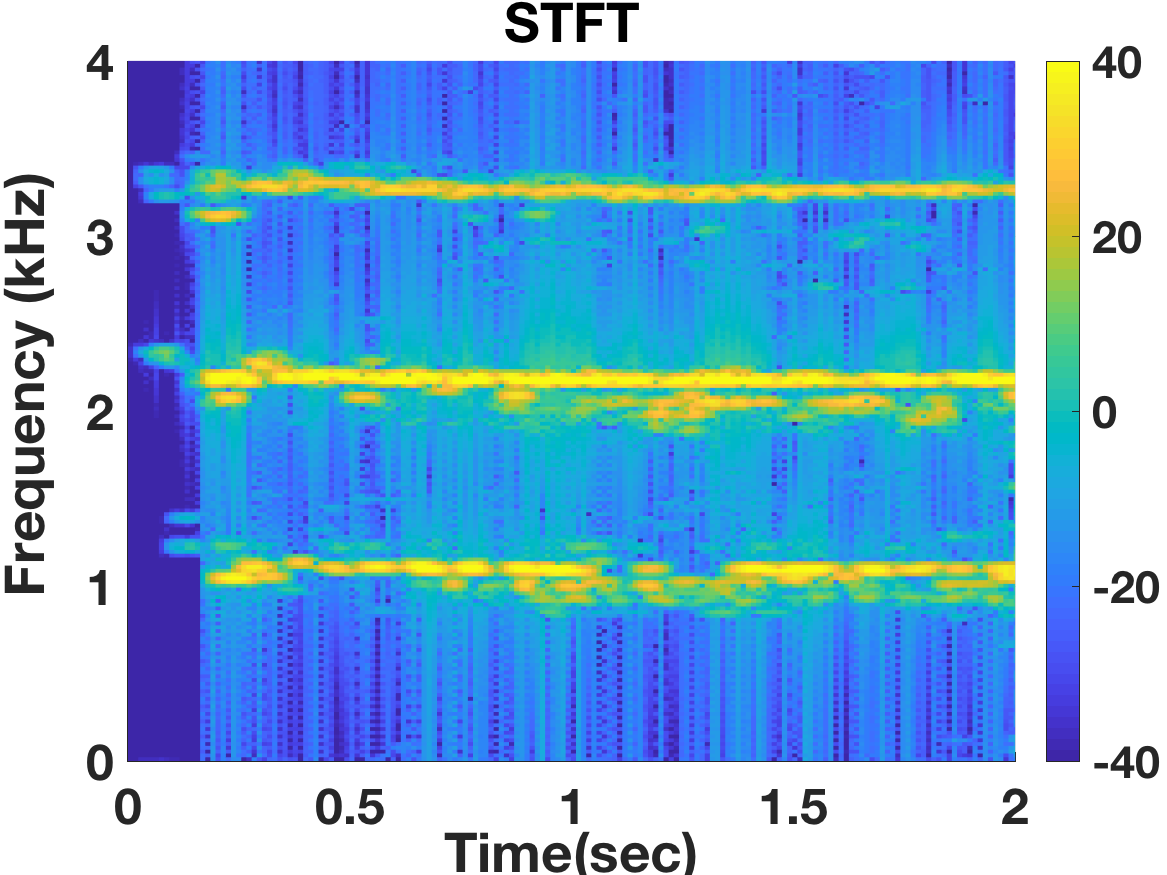
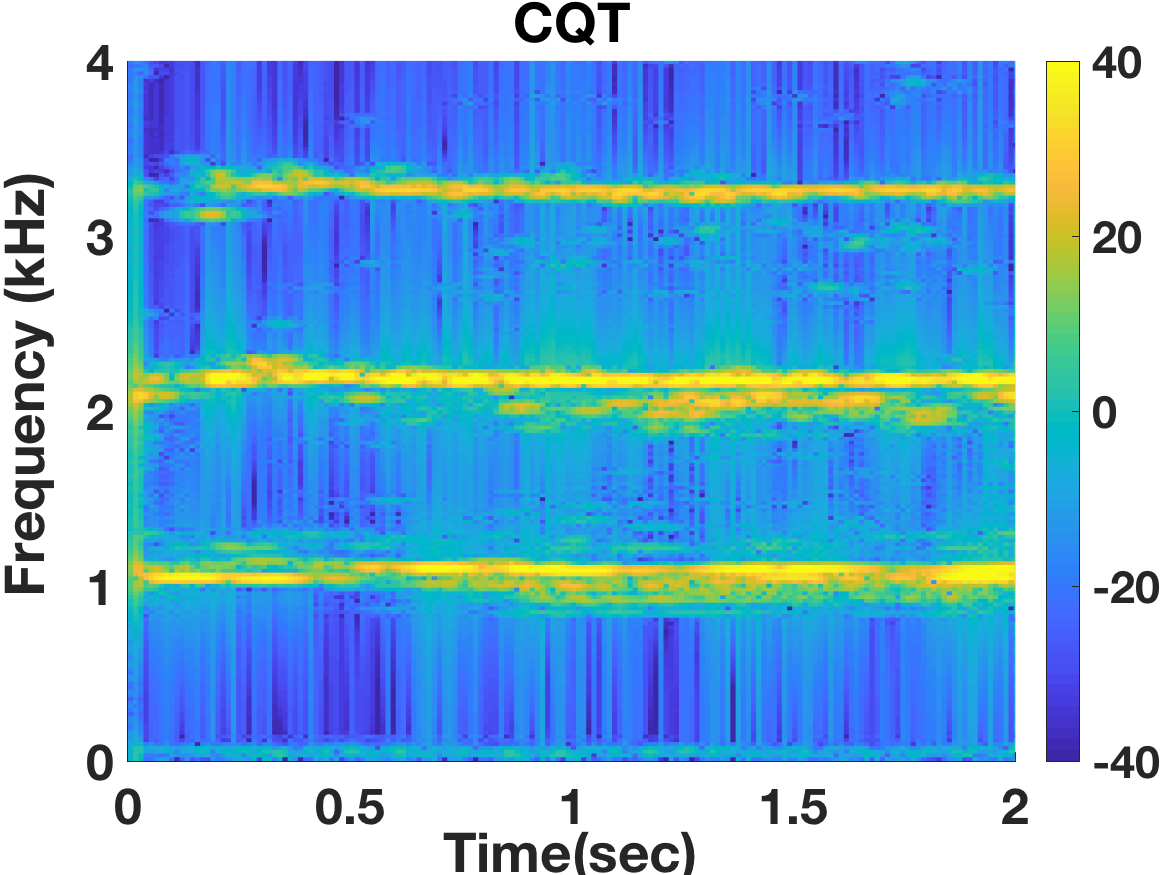
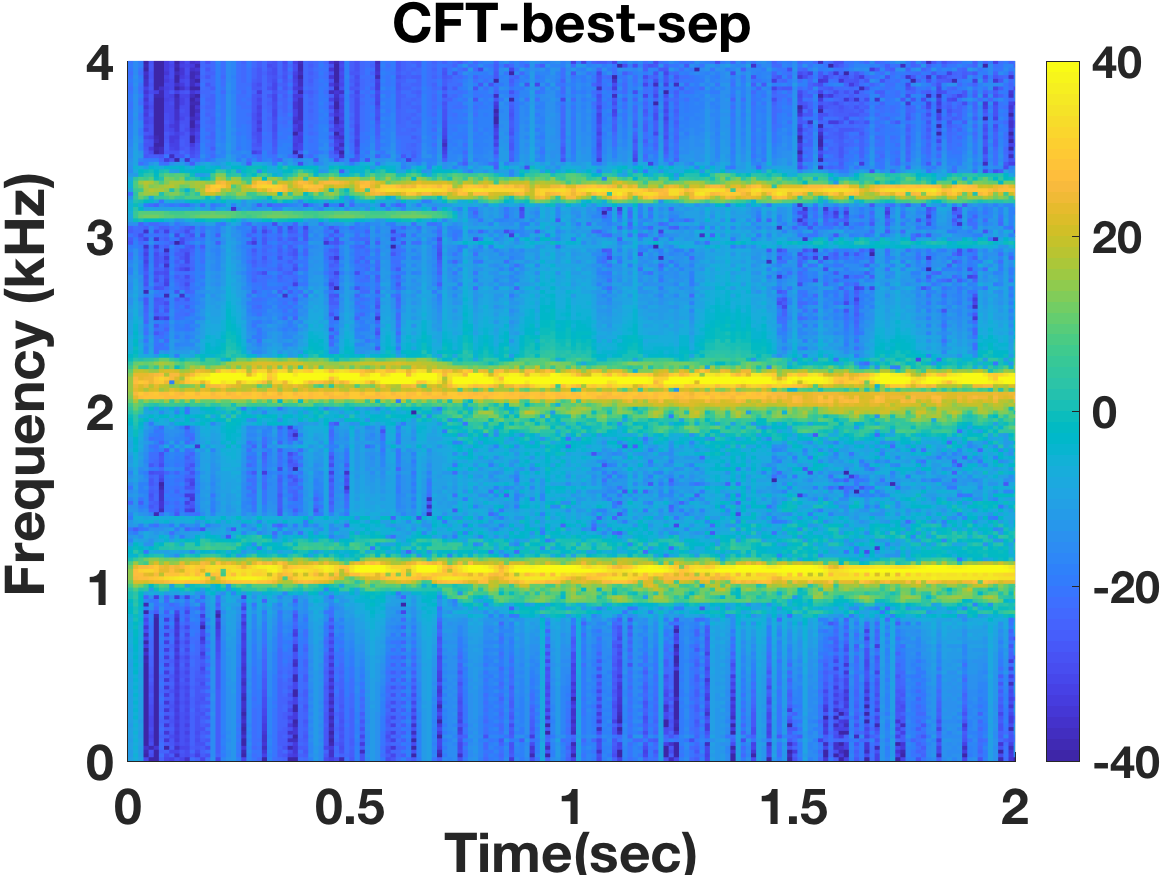
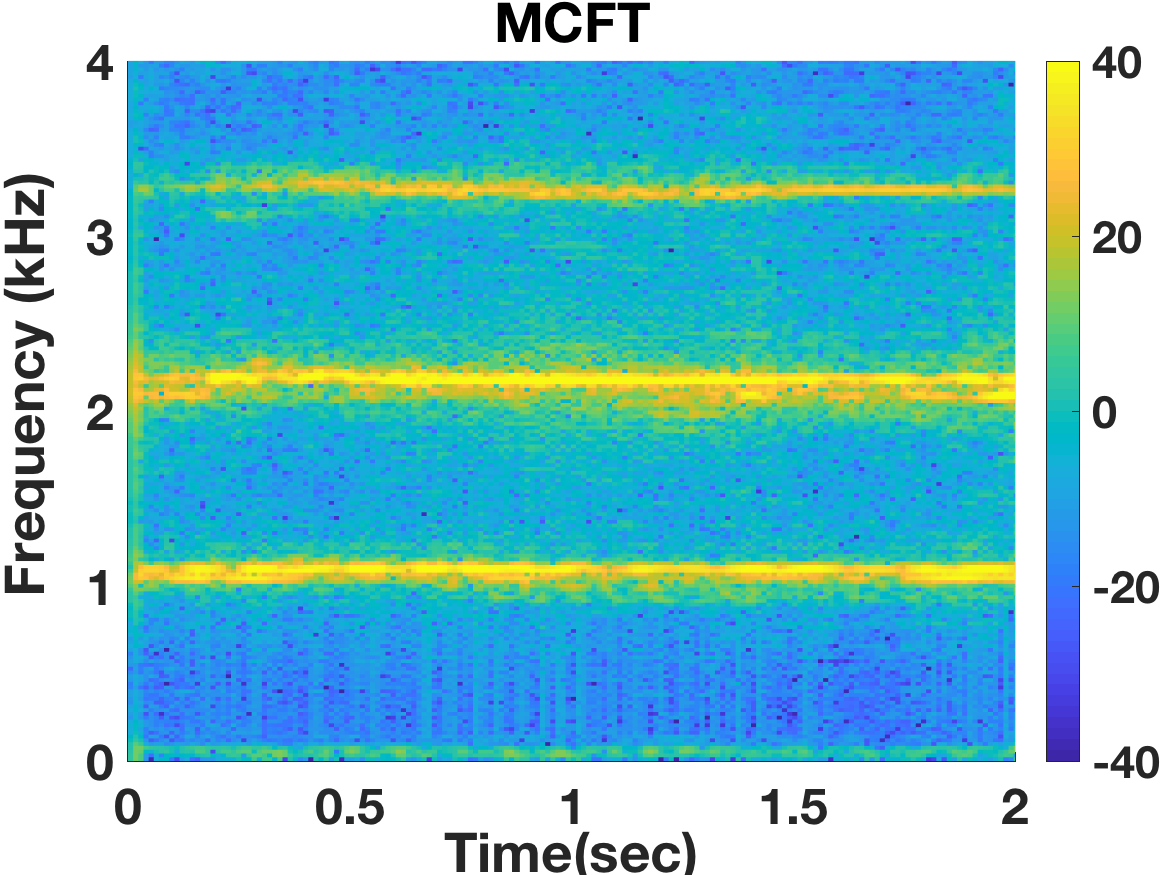
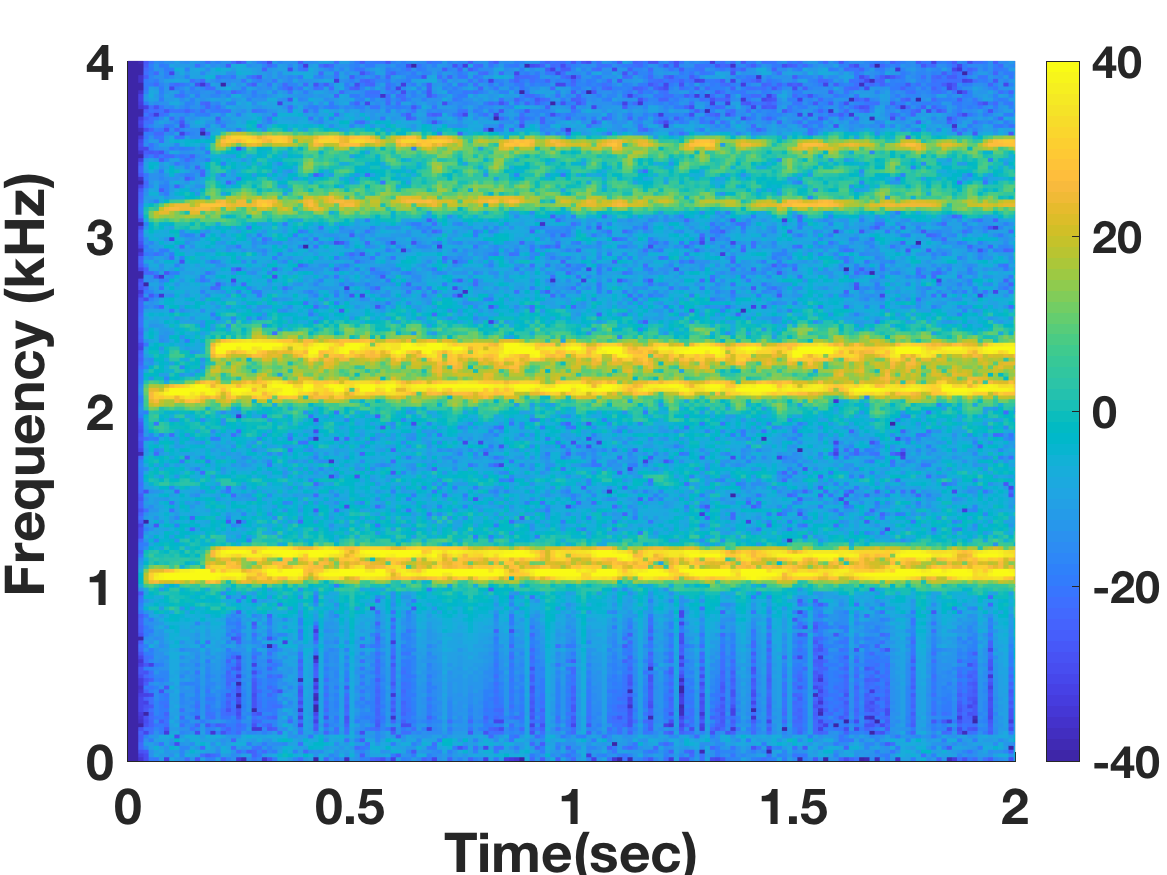
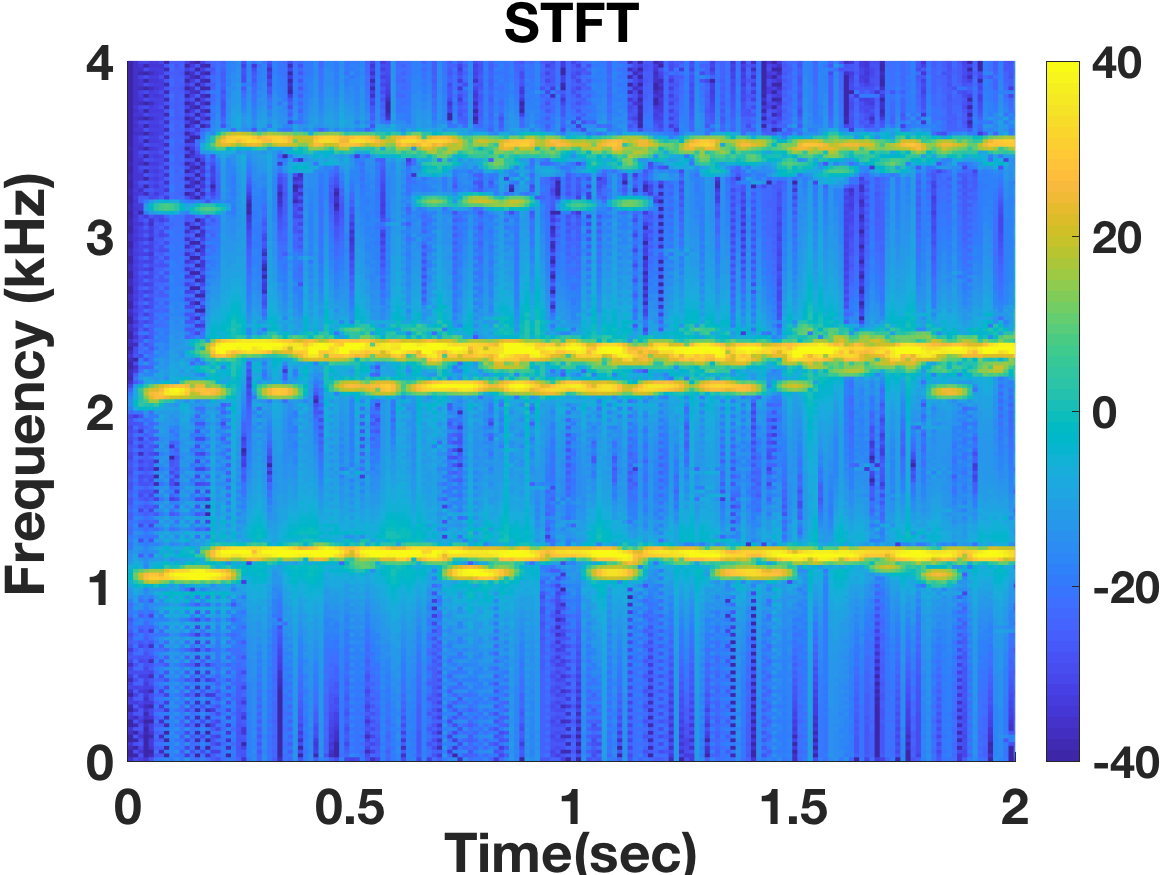
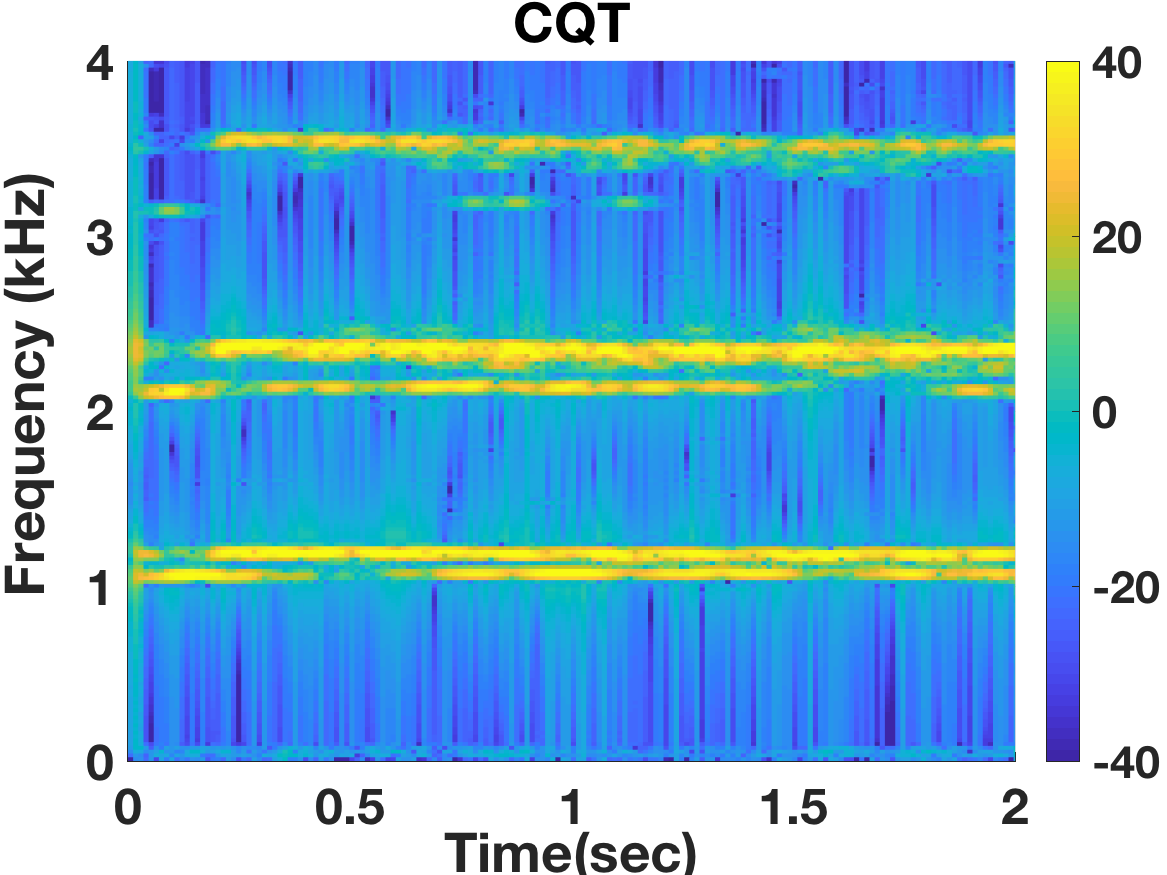
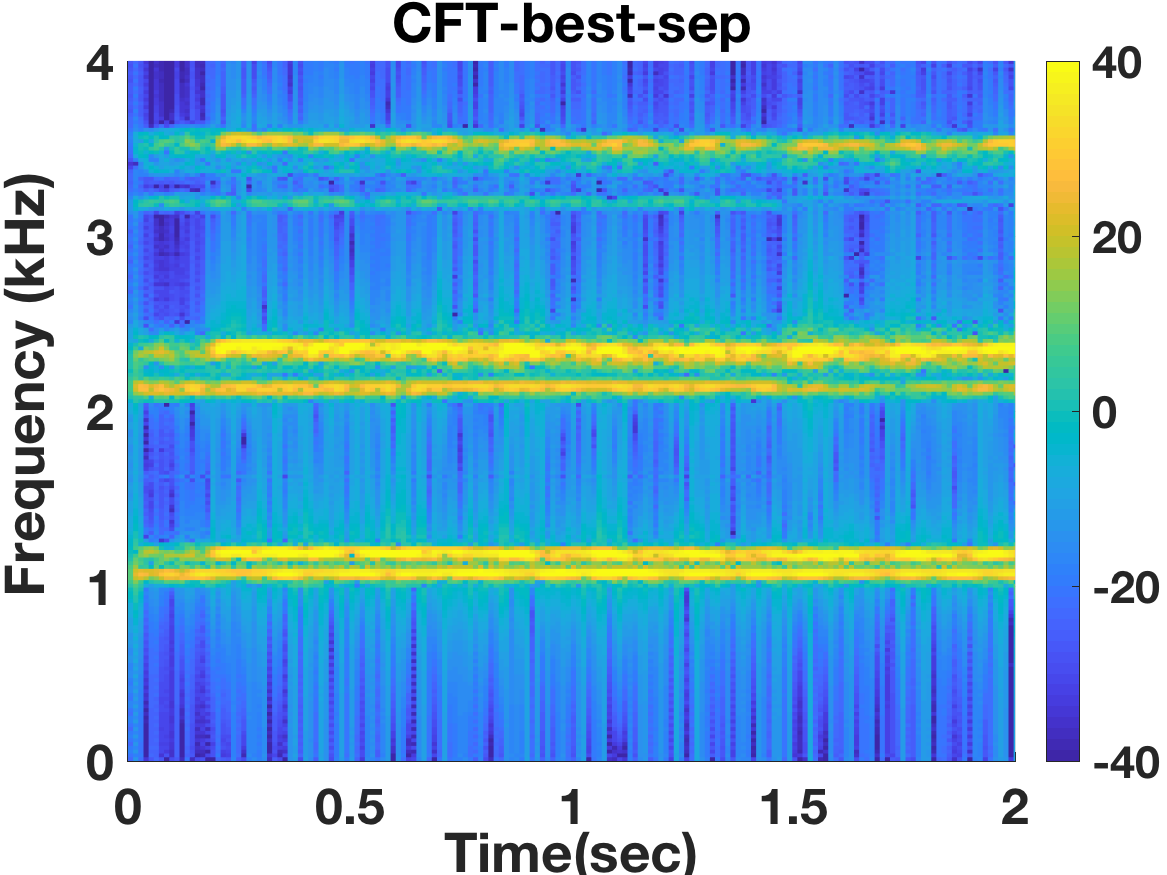
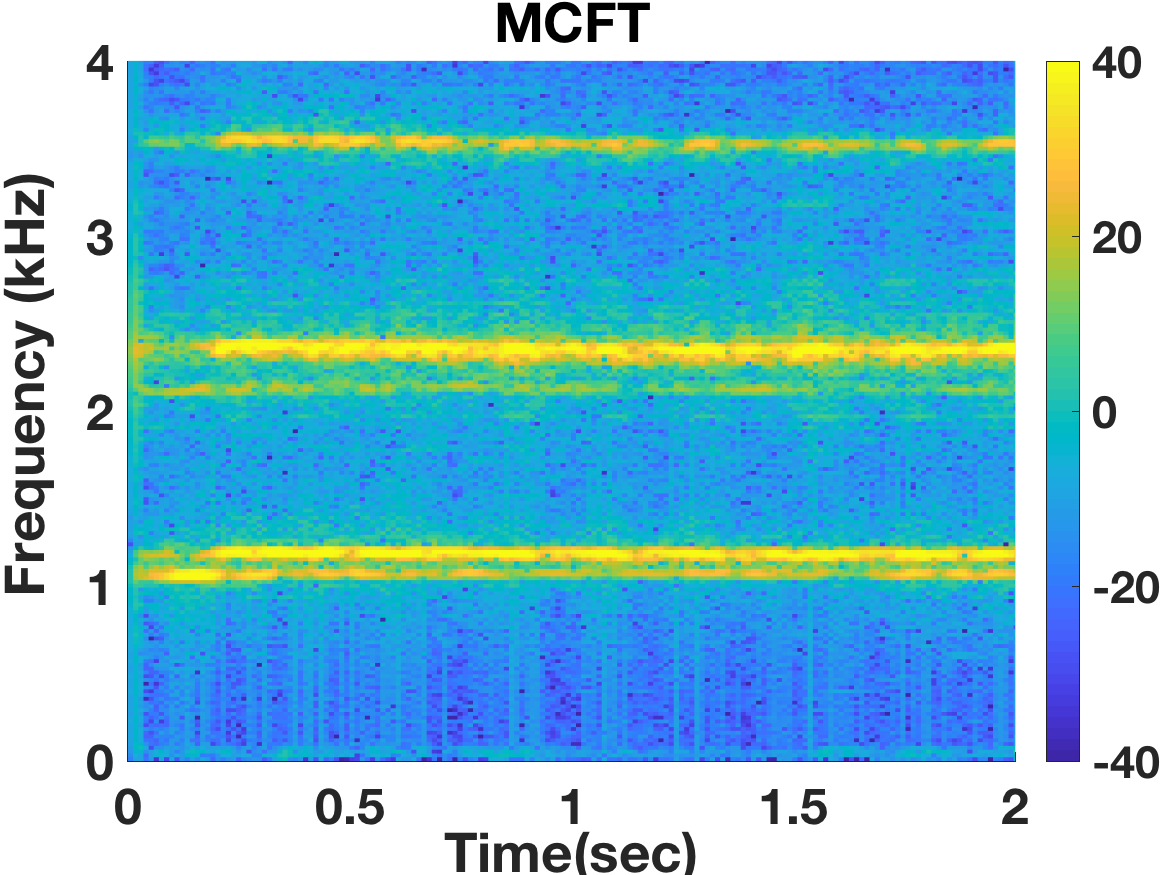
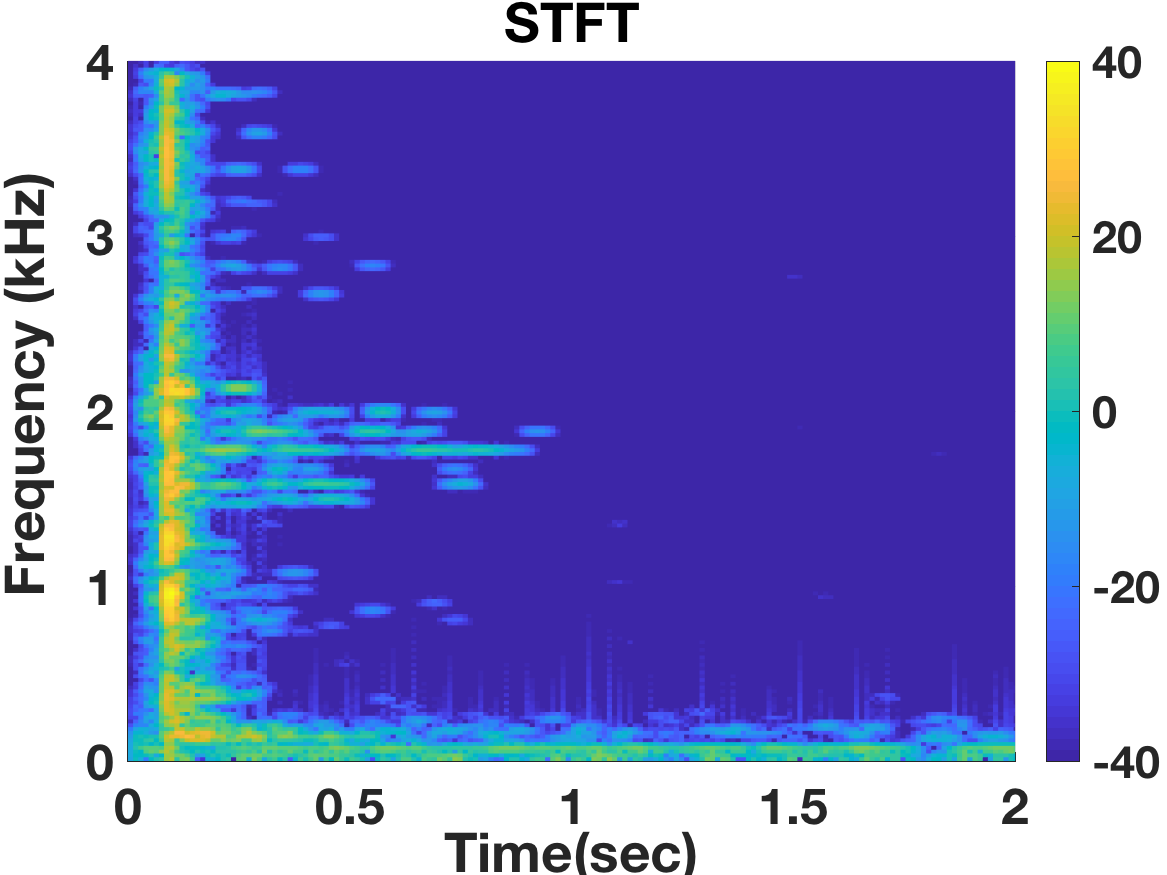
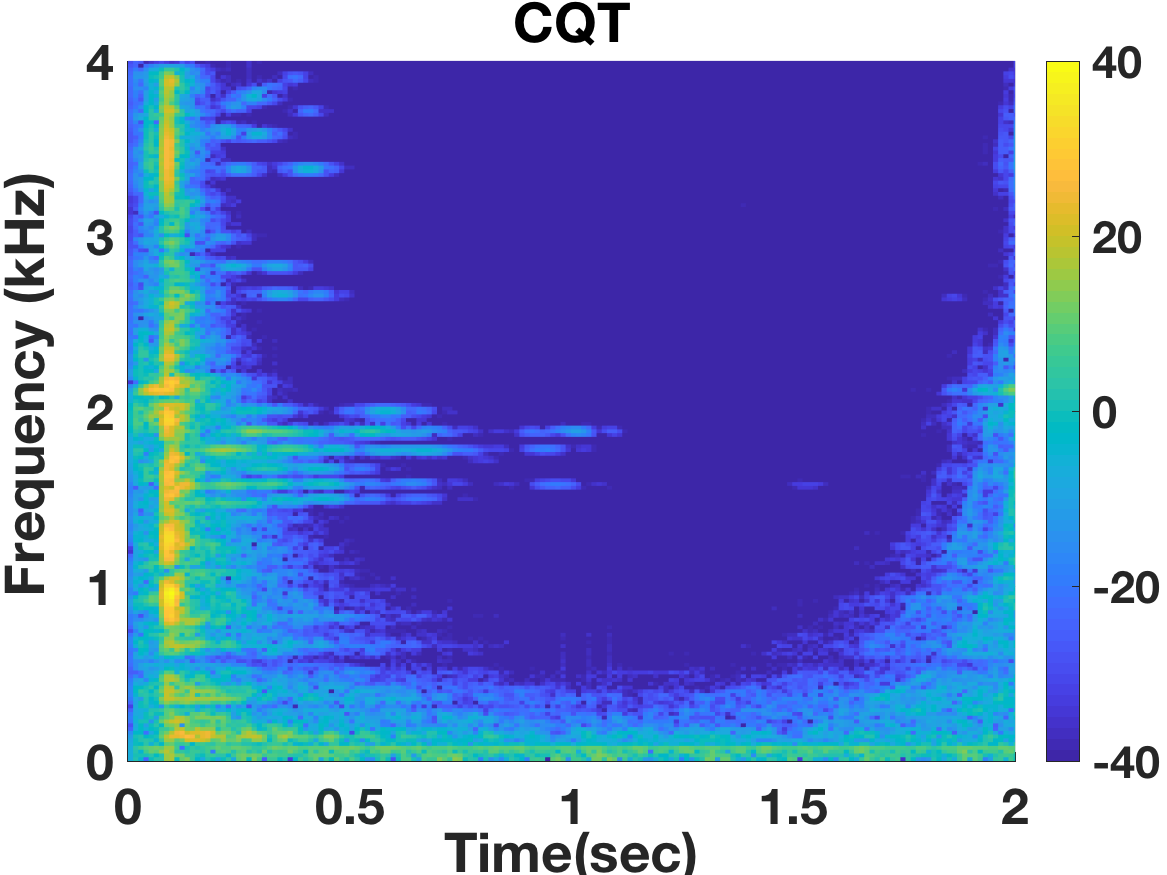
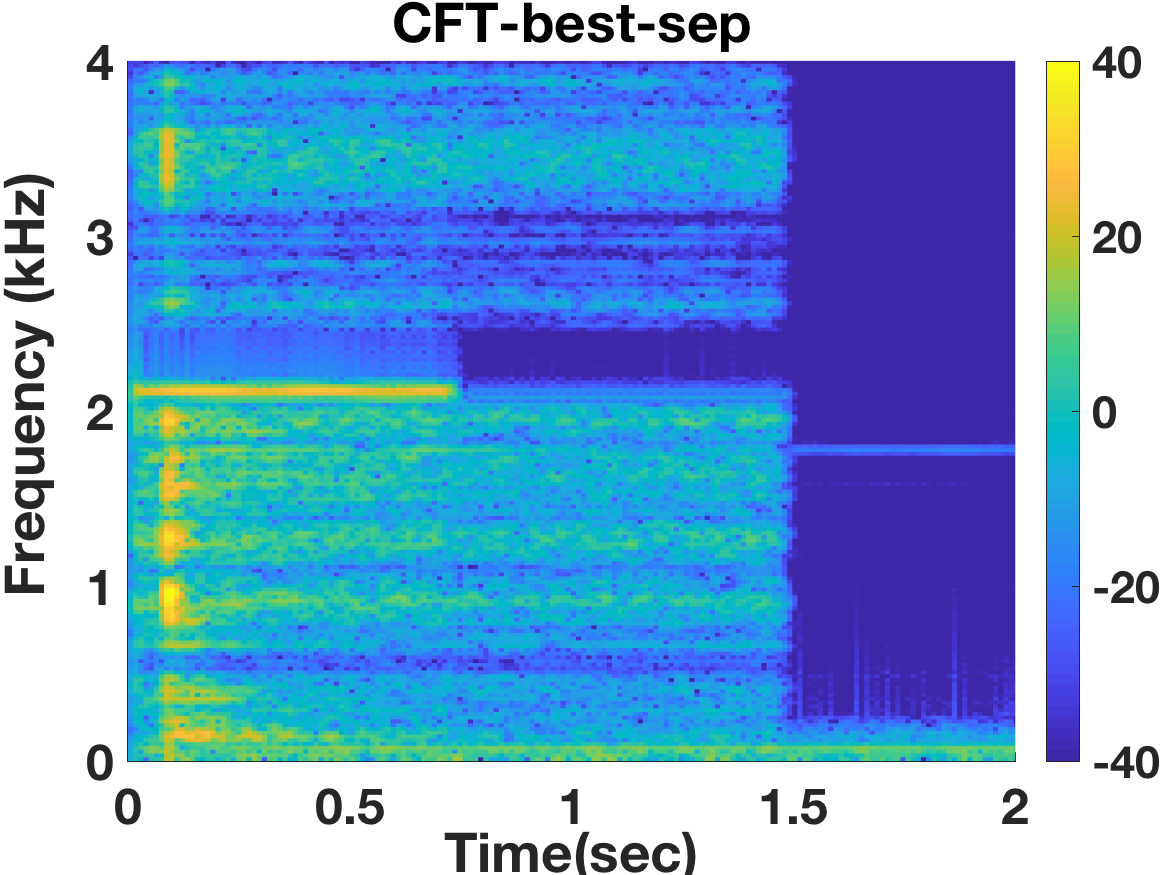
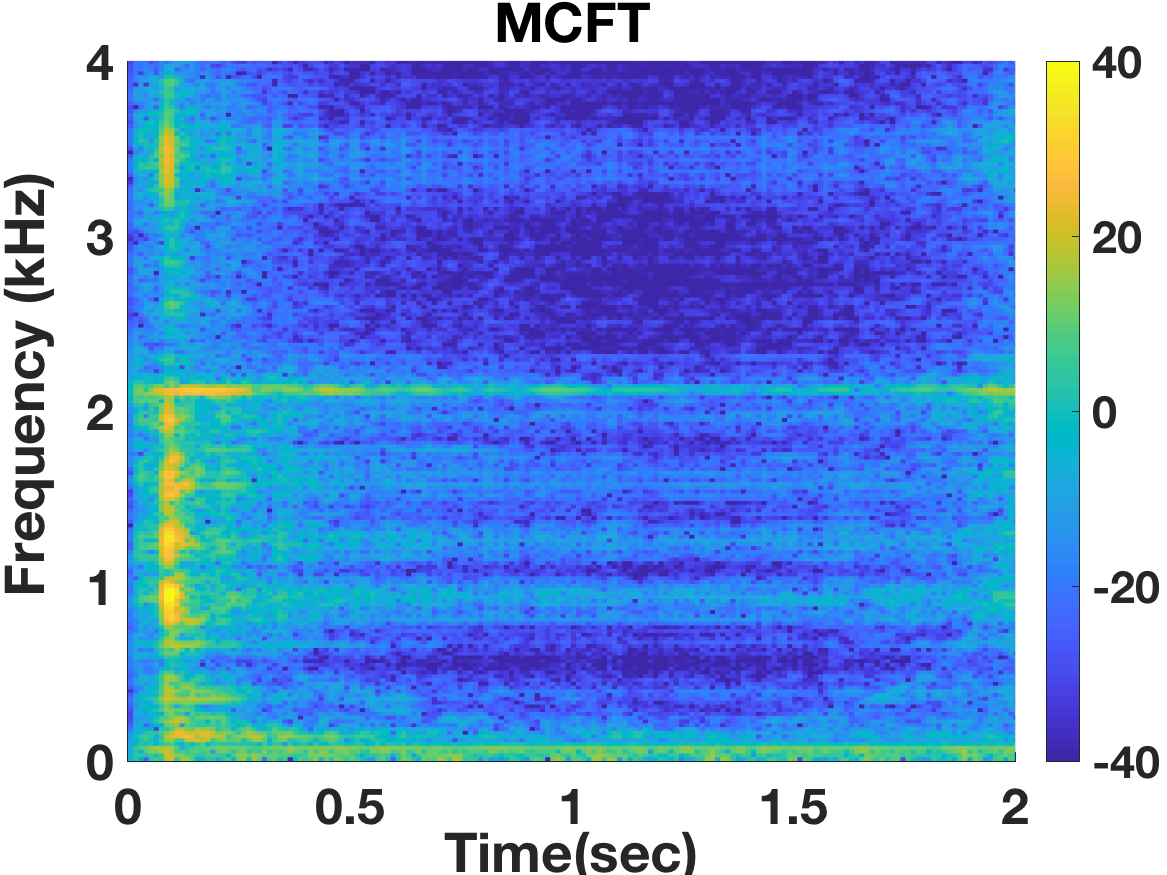
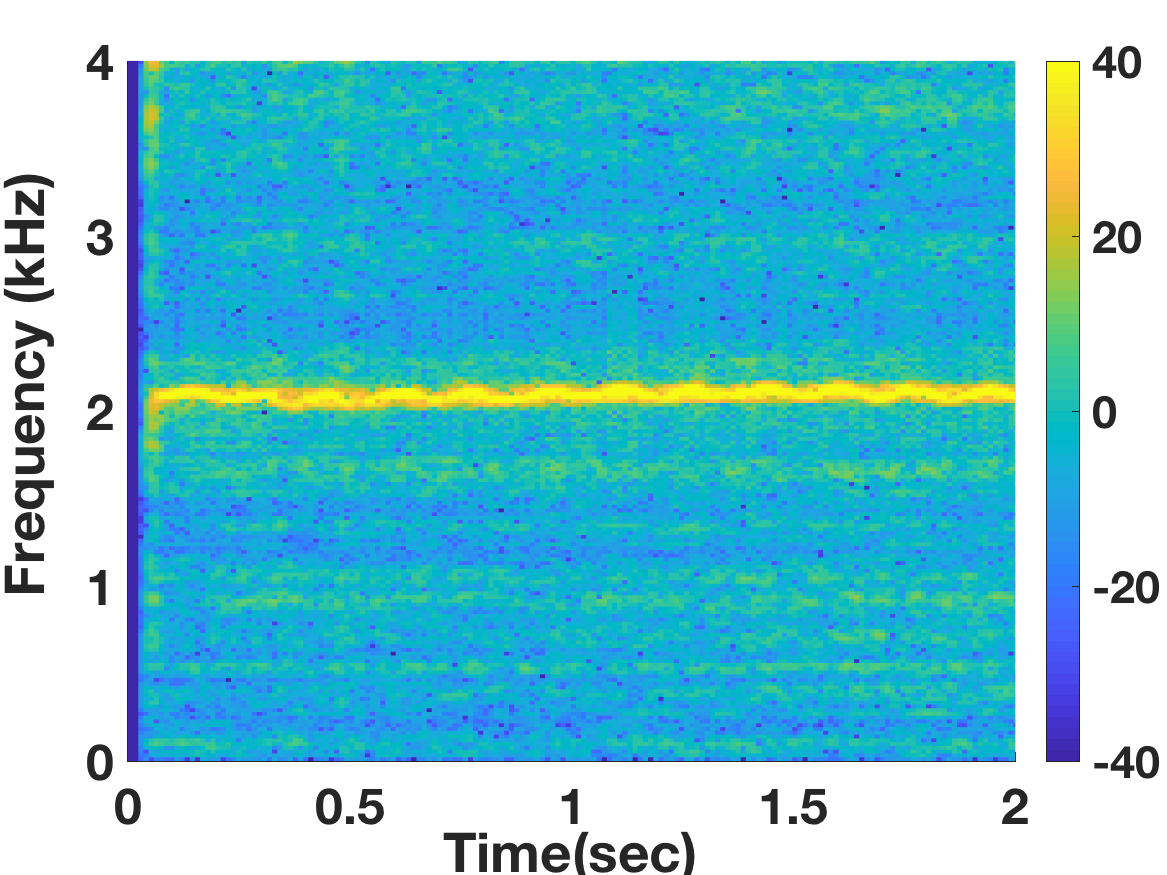
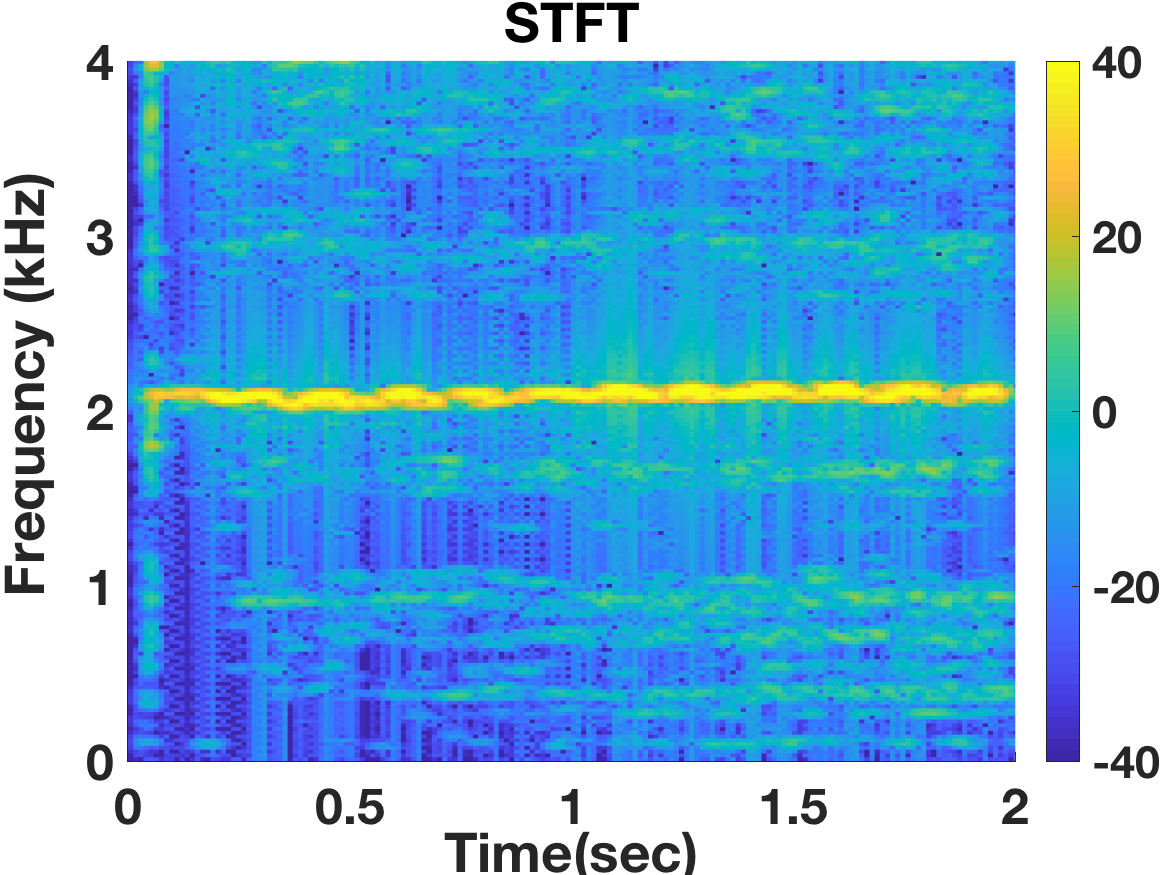
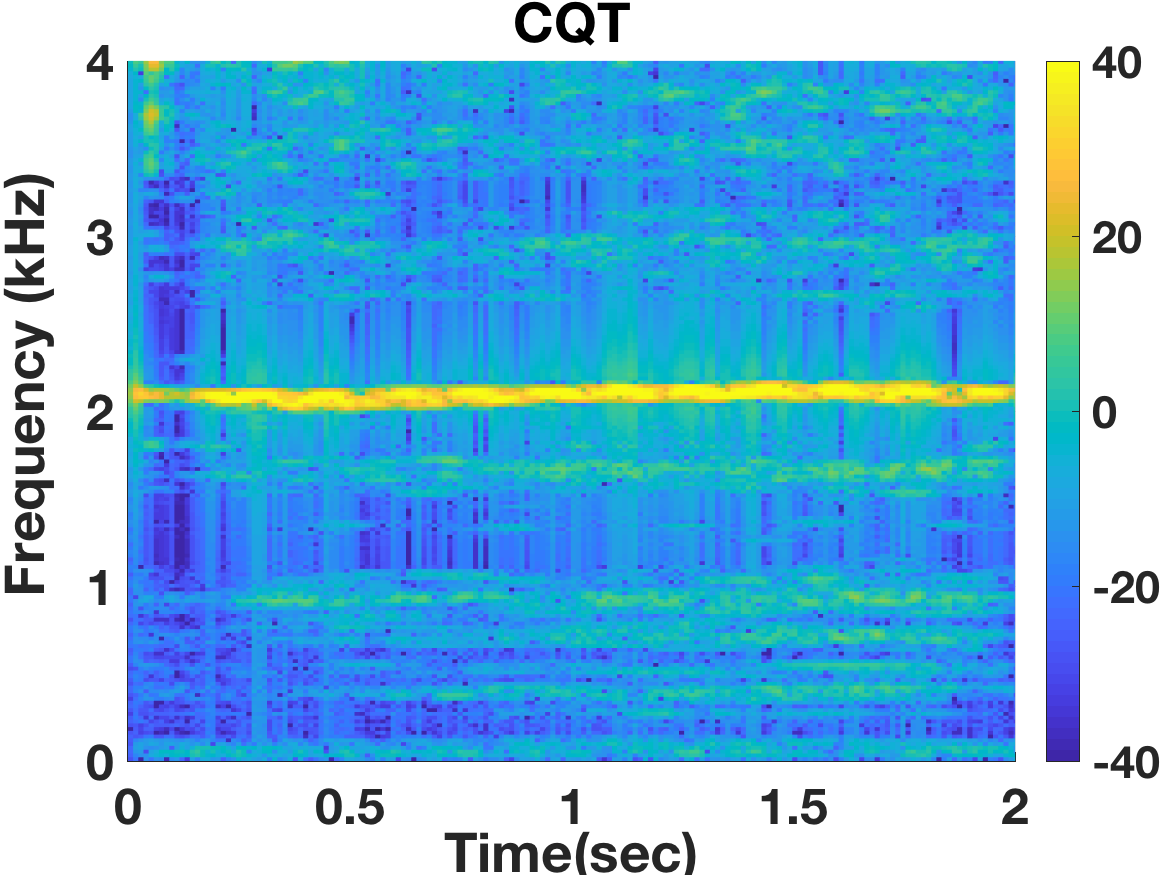
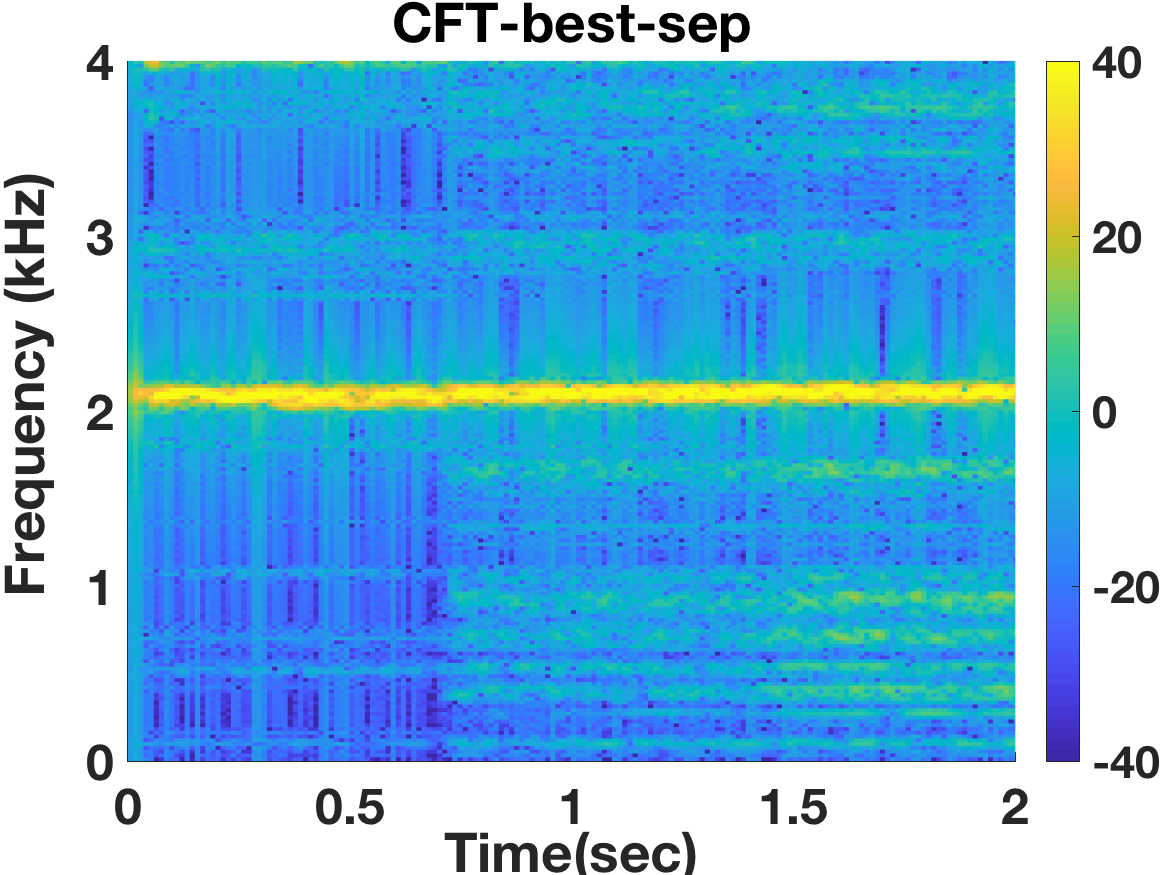
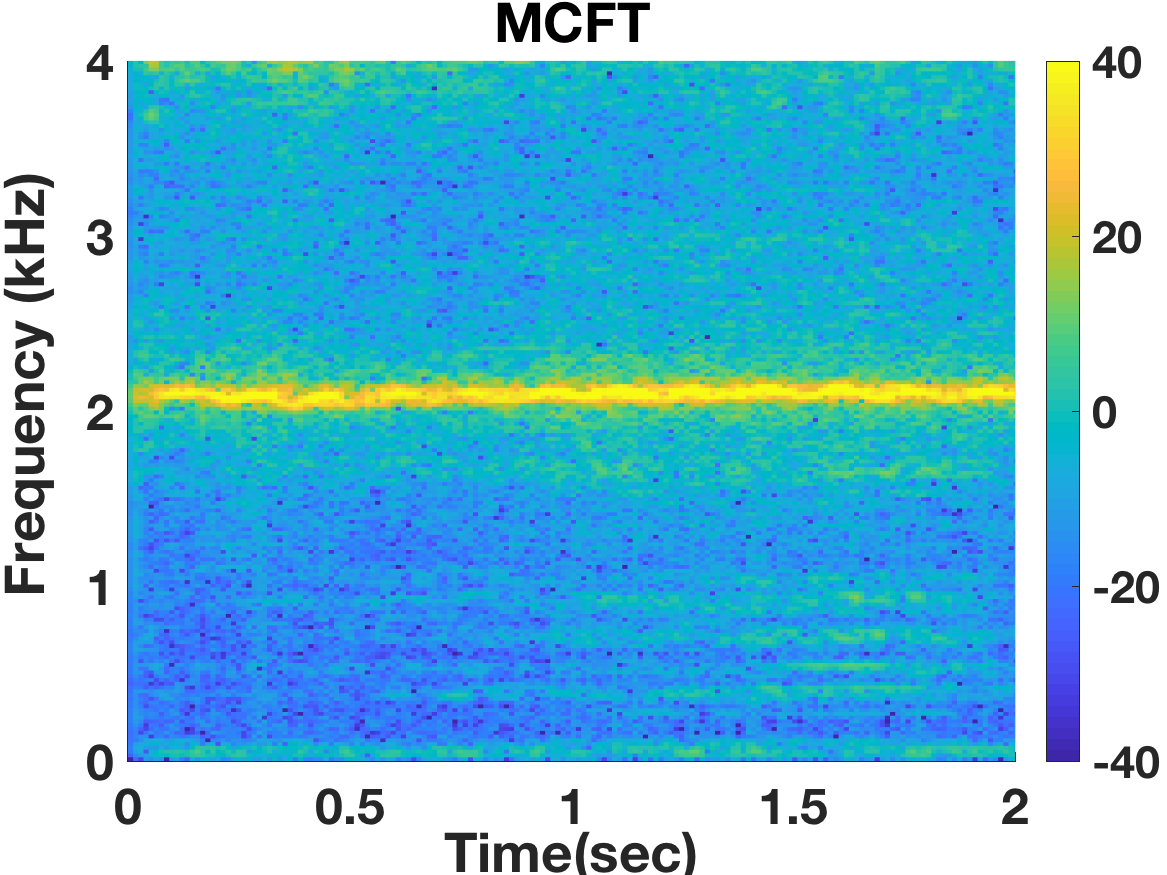
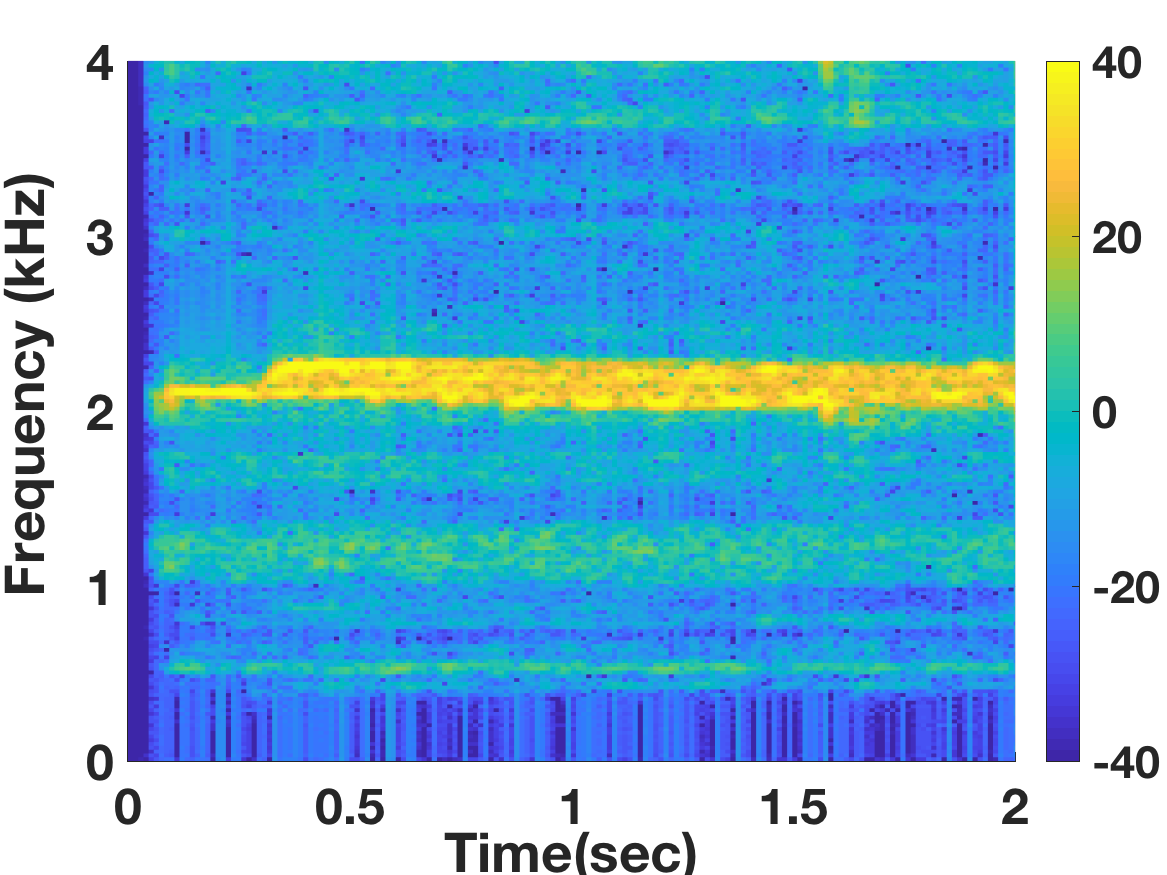
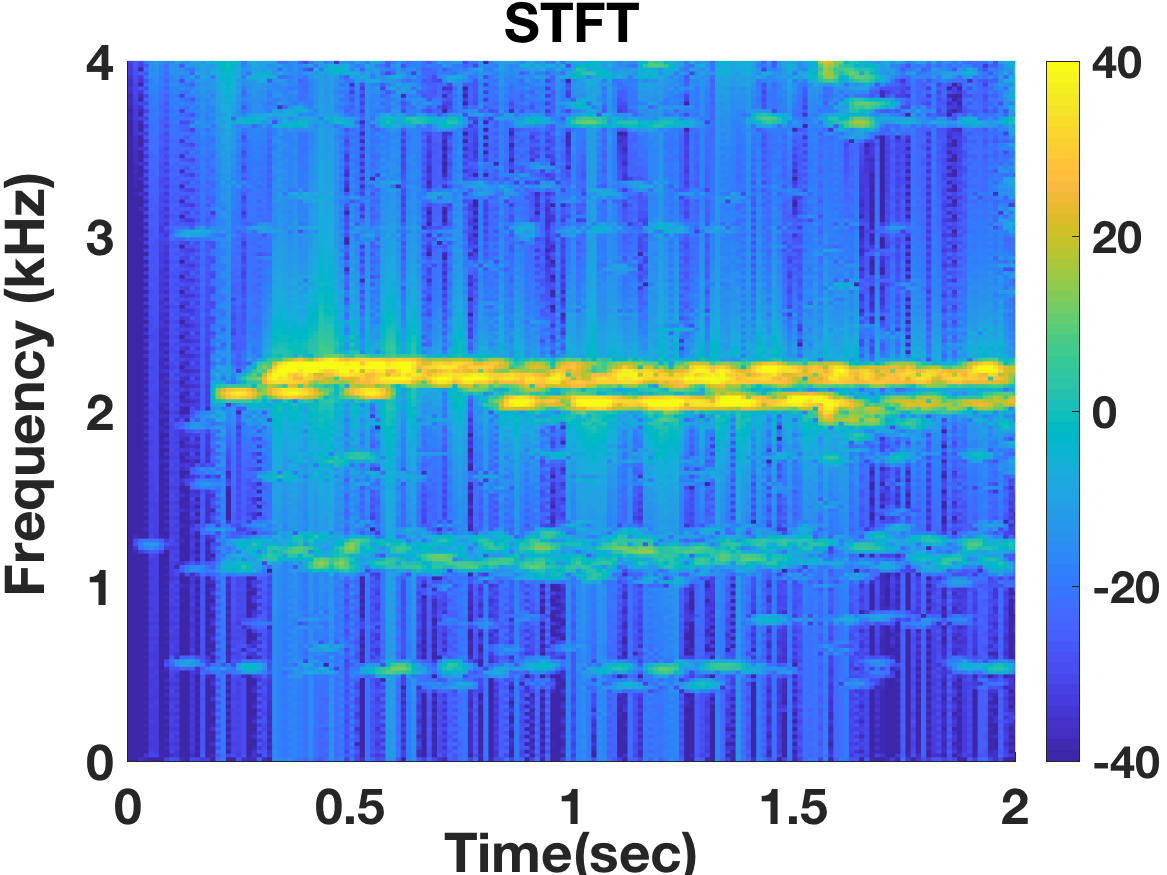
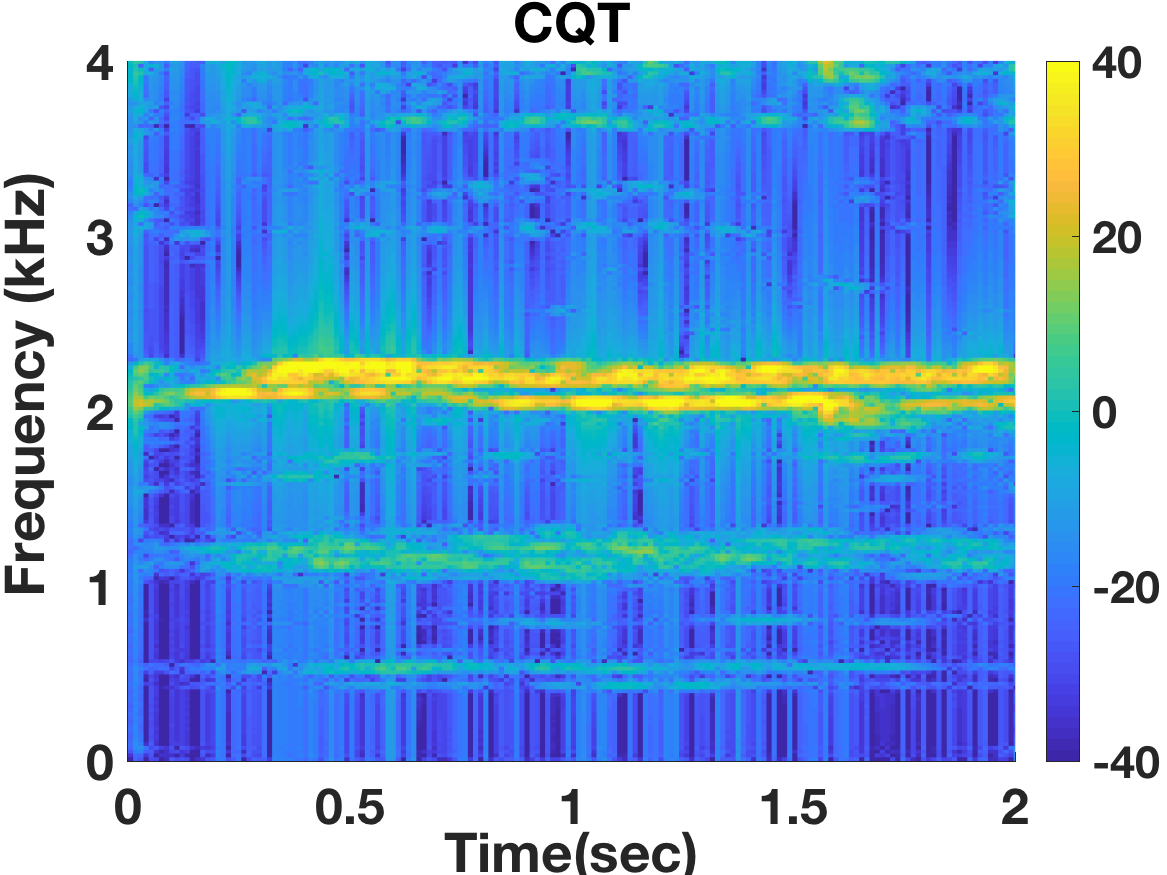
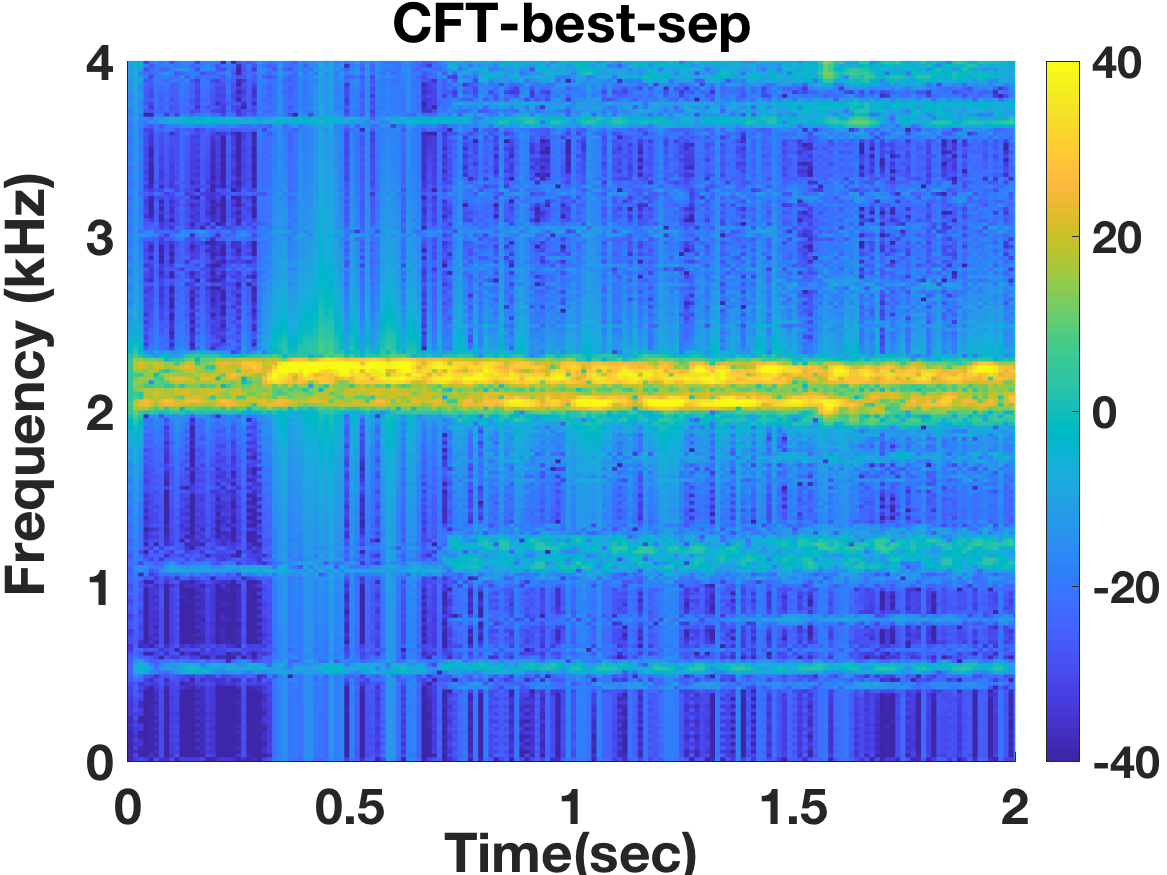
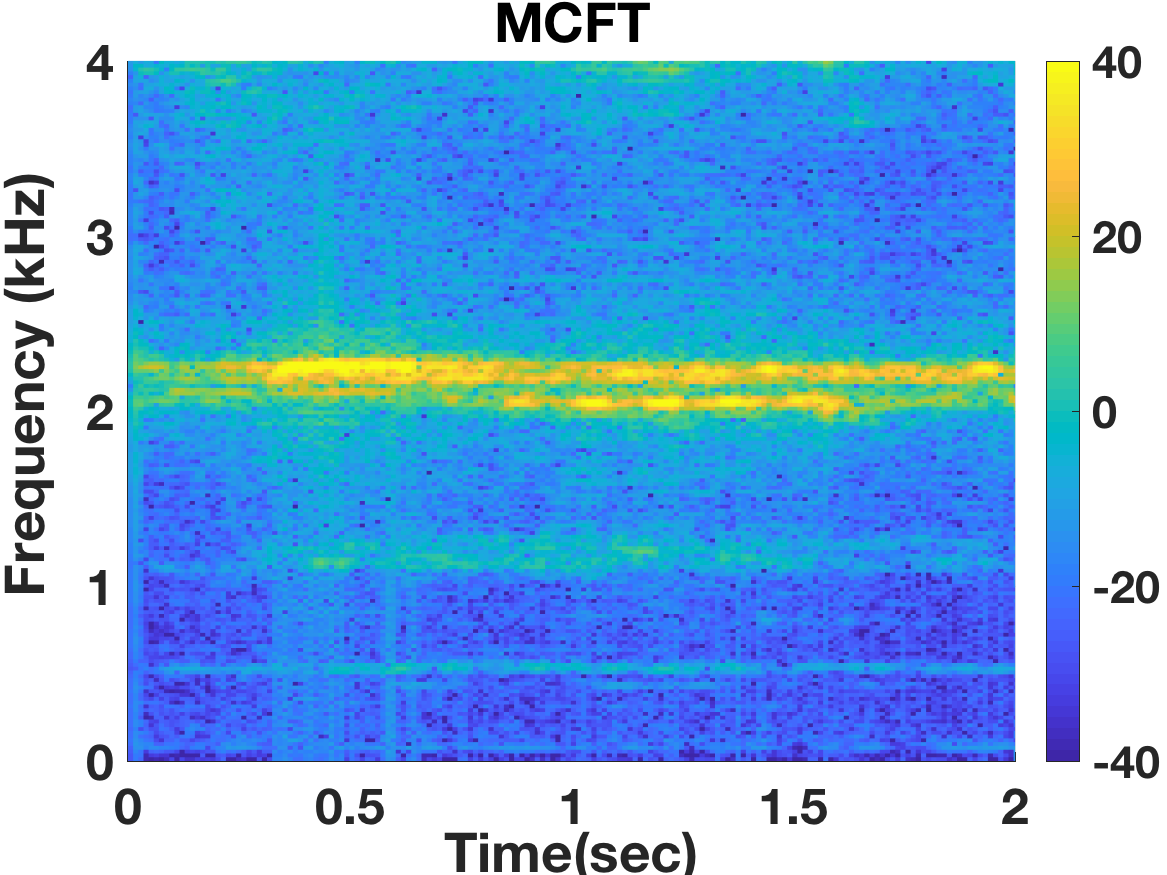
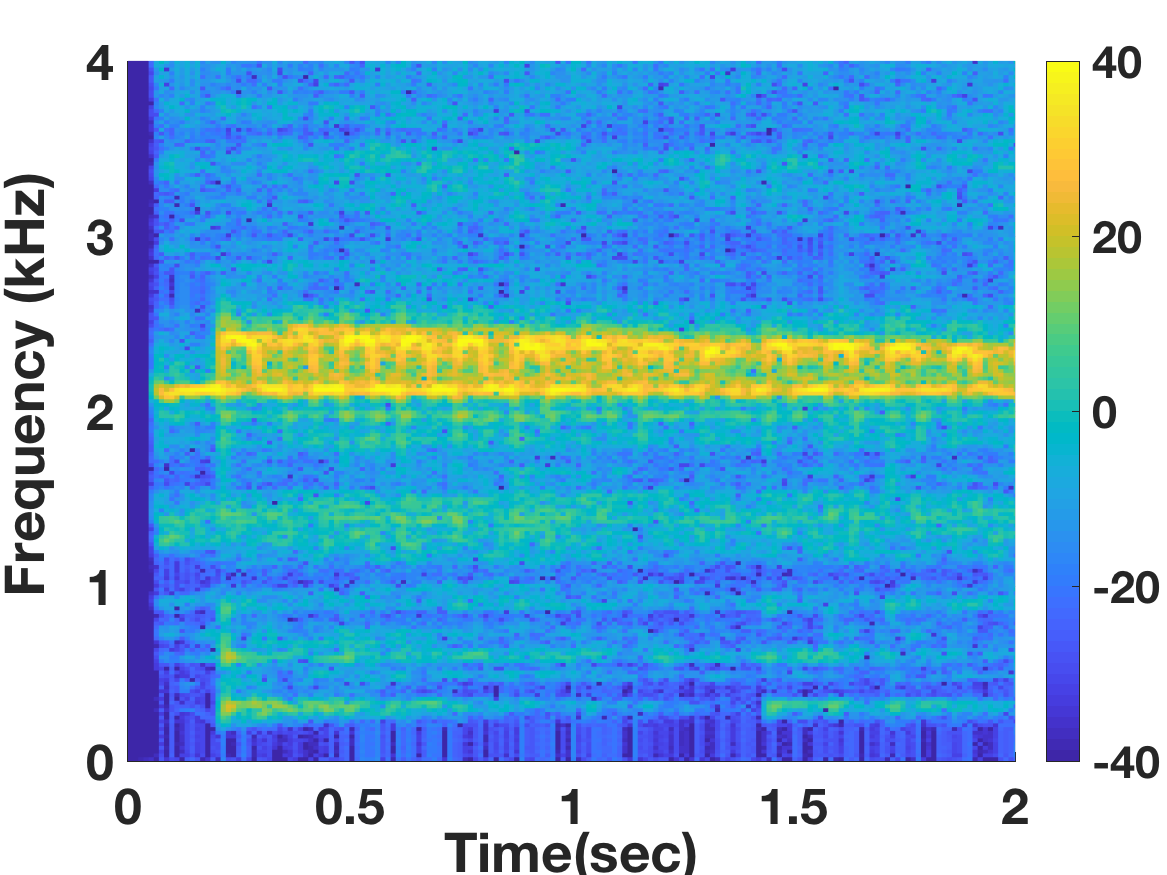
Time-frequency plots for the original sources and estimated sources are also provided. In order to make visual comparison across representations easier, all results are displayed in the STFT domain. It should, however, be noted that the MCFT (and clearly the CQT) use the CQT domain as the time-frequency analysis stage. The frequency range in all time-frequency plots is limited to 0 - 4 kHz for visual purposes.
Original Source 1: C7-piano
Estimated Source 1:
Masking Thr = 10 dB
Original Source 2: C7-violin-vibrato
Estimated Source 2:
Masking Thr
STFT
CQT
CFT-best-sep
MCFT
10 dB
Original Source 2: C7-violin-vibrato
Estimated Source 2:
Masking Thr = 10 dB
Original Source 3: C7-violin-minor trill
Estimated Source 3:
Masking Thr
STFT
CQT
CFT-best-sep
MCFT
10 dB
Original Source 3: C7-violin-minor trill
Estimated Source 3:
Masking Thr = 10 dB
Original Source 4: C7-violin-major trill
Estimated Source 4:
Masking Thr
STFT
CQT
CFT-best-sep
MCFT
10 dB
Original Source 4: C7-violin-major trill
Estimated Source 4:
Masking Thr = 10 dB
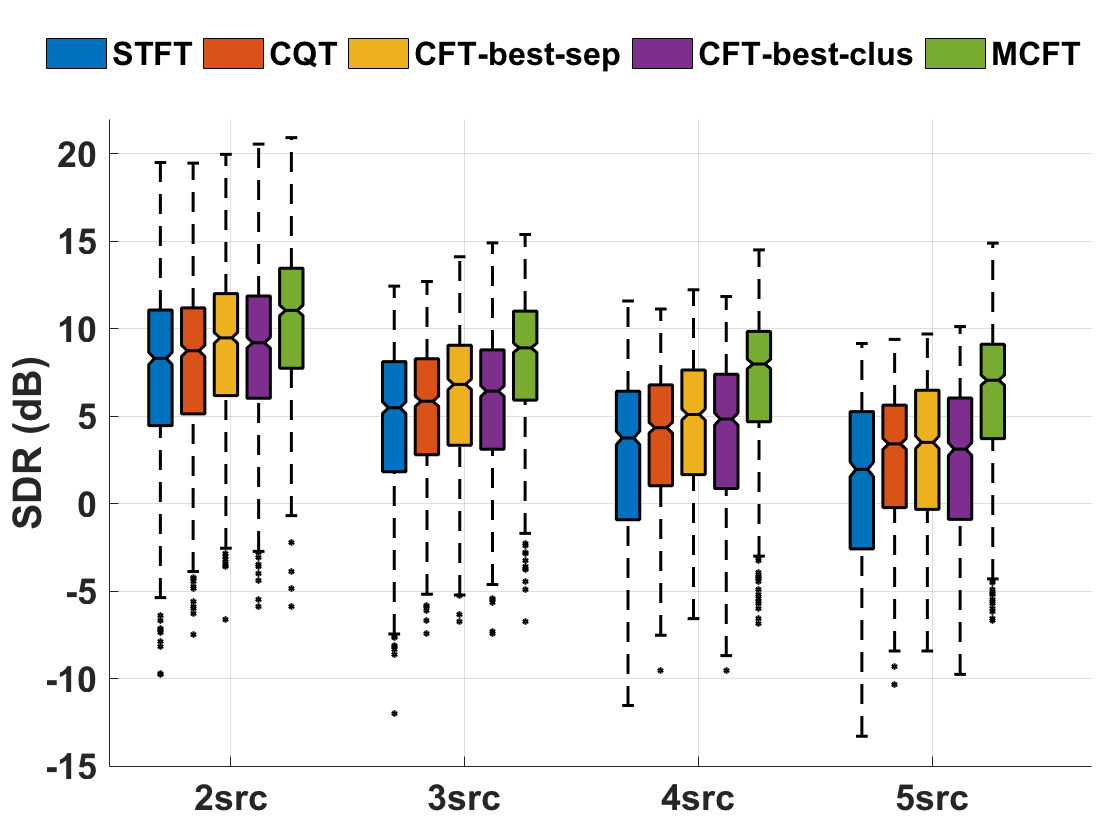
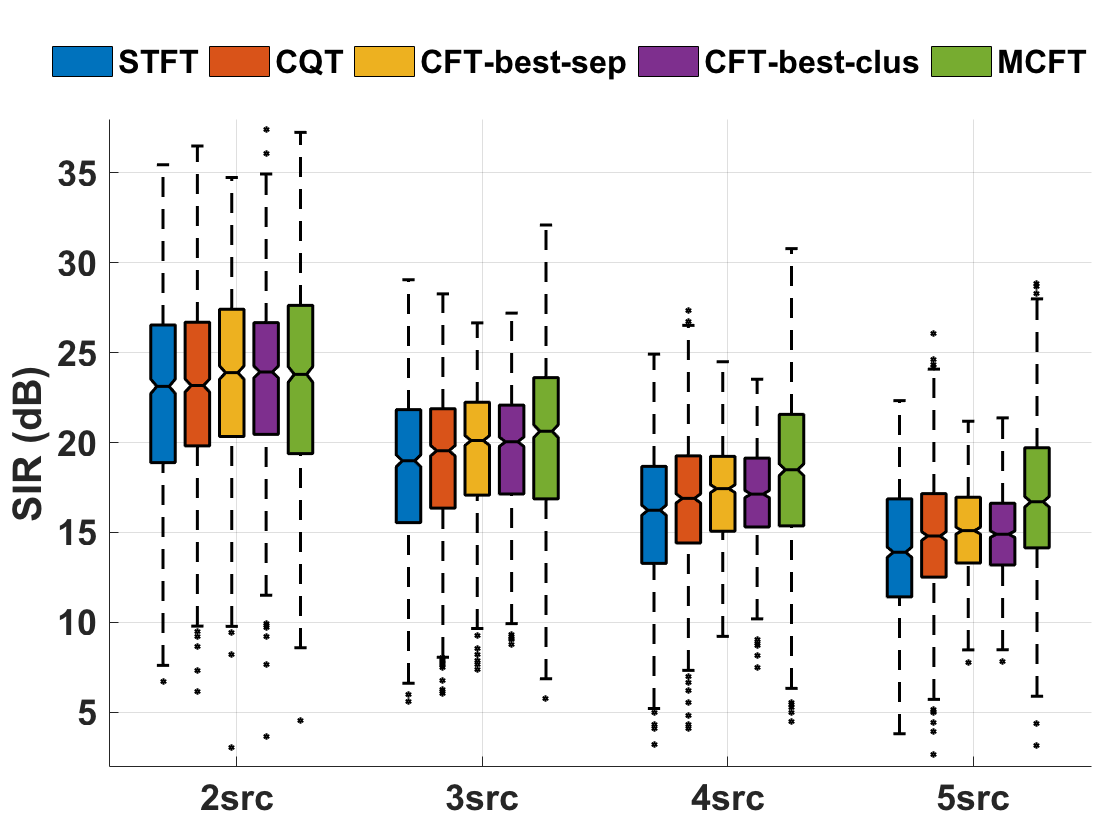
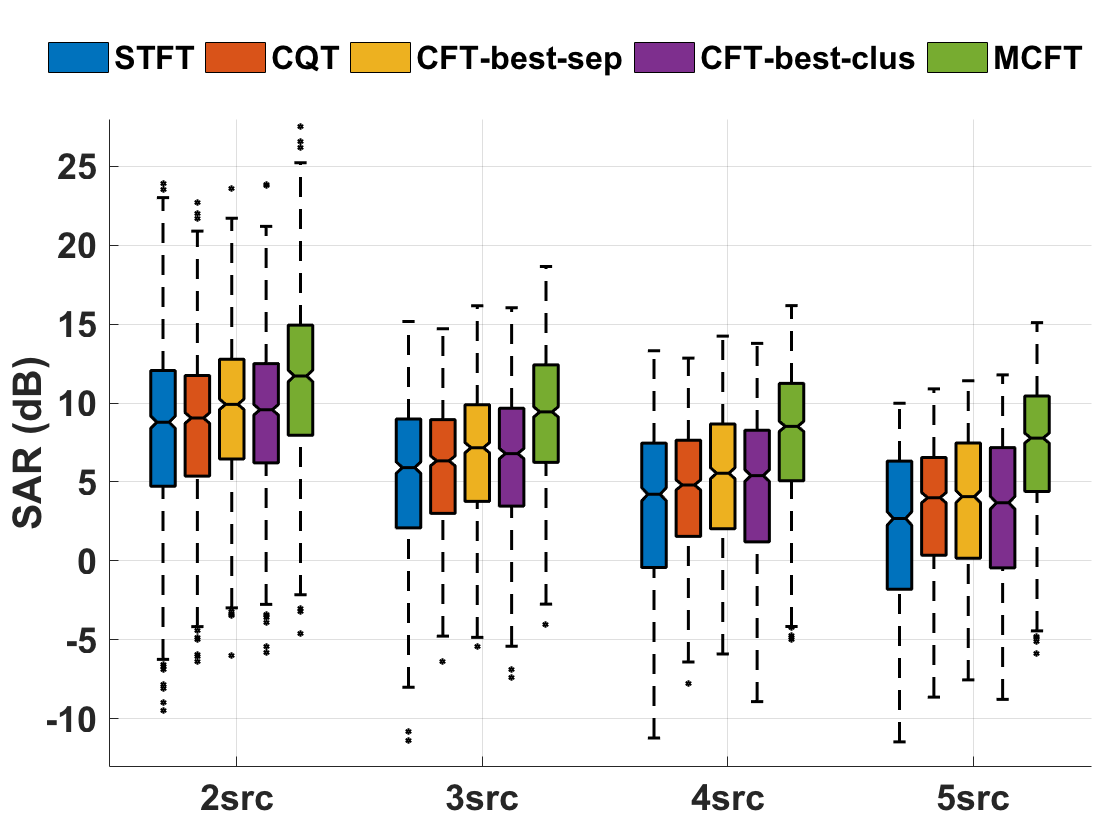
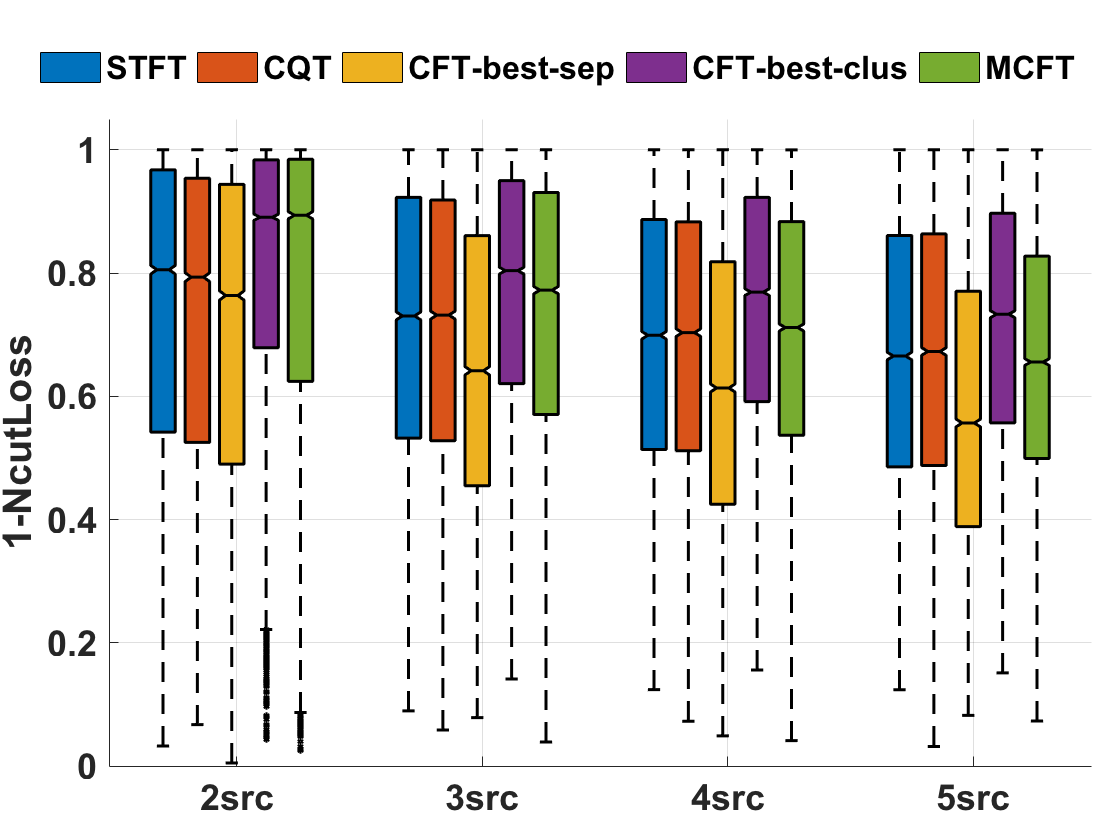
Experimental Results
In this section, we present detailed results of our separability and clusterability experiments. Box plots show the distribution of separability and clusterability values. The boxes cover the values in the range of the first and third quartiles, with the middle notch indicating the median.
Tables contain the results of statistical significance tests. The null hypothesis in all statistical tests is that the median of the results for the MCFT is less or equal the median of other representations, or equivalently, the MCFT does not provide any improvement. In separability statistical tests, n = number of mixtures * number of masking thresholds = 126 * 7 = 882, and in clusterability statistical tests, n = number of mixtures * number of masking thresholds * number of similarity kernel widths = 126 * 7 * 10 = 8820. In all tables, median diff = median(MCFT) − median(other representation)" (positive values indicate improved performance for the MCFT).
 Estimated Source 1:
 Masking Thr = 15 dB
 Masking Thr = 30 dB
 Estimated Source 2:
 Masking Thr = 15 dB
 Masking Thr = 30 dB
 Estimated Source 1:
 Masking Thr = 15 dB
 Masking Thr = 30 dB
 Estimated Source 2:
 Masking Thr = 15 dB
 Masking Thr = 30 dB
 Estimated Source 1:
 Masking Thr = 15 dB
 Masking Thr = 30 dB
 Estimated Source 2:
 Masking Thr = 15 dB
 Masking Thr = 30 dB
 Estimated Source 1:
Masking Thr = 15 dB
Estimated Source 1:
Masking Thr = 15 dB
 Original Source 2: C6-piccolo trumpet-minor trill
Estimated Source 2:
Original Source 2: C6-piccolo trumpet-minor trill
Estimated Source 2:
 Estimated Source 2:
Masking Thr = 15 dB
Estimated Source 2:
Masking Thr = 15 dB
 Original Source 3: C6-piccolo trumpet-major trill
Estimated Source 3:
Original Source 3: C6-piccolo trumpet-major trill
Estimated Source 3:
 Estimated Source 3:
Masking Thr = 15 dB
Estimated Source 3:
Masking Thr = 15 dB
 Estimated Source 1:
Masking Thr = 10 dB
Estimated Source 1:
Masking Thr = 10 dB
 Original Source 2: C7-violin-vibrato
Estimated Source 2:
Original Source 2: C7-violin-vibrato
Estimated Source 2:
 Estimated Source 2:
Masking Thr = 10 dB
Estimated Source 2:
Masking Thr = 10 dB
 Original Source 3: C7-violin-minor trill
Estimated Source 3:
Original Source 3: C7-violin-minor trill
Estimated Source 3:
 Estimated Source 3:
Masking Thr = 10 dB
Estimated Source 3:
Masking Thr = 10 dB
 Original Source 4: C7-violin-major trill
Estimated Source 4:
Original Source 4: C7-violin-major trill
Estimated Source 4:
 Estimated Source 4:
Masking Thr = 10 dB
Estimated Source 4:
Masking Thr = 10 dB